Fig. 1.
Download original image
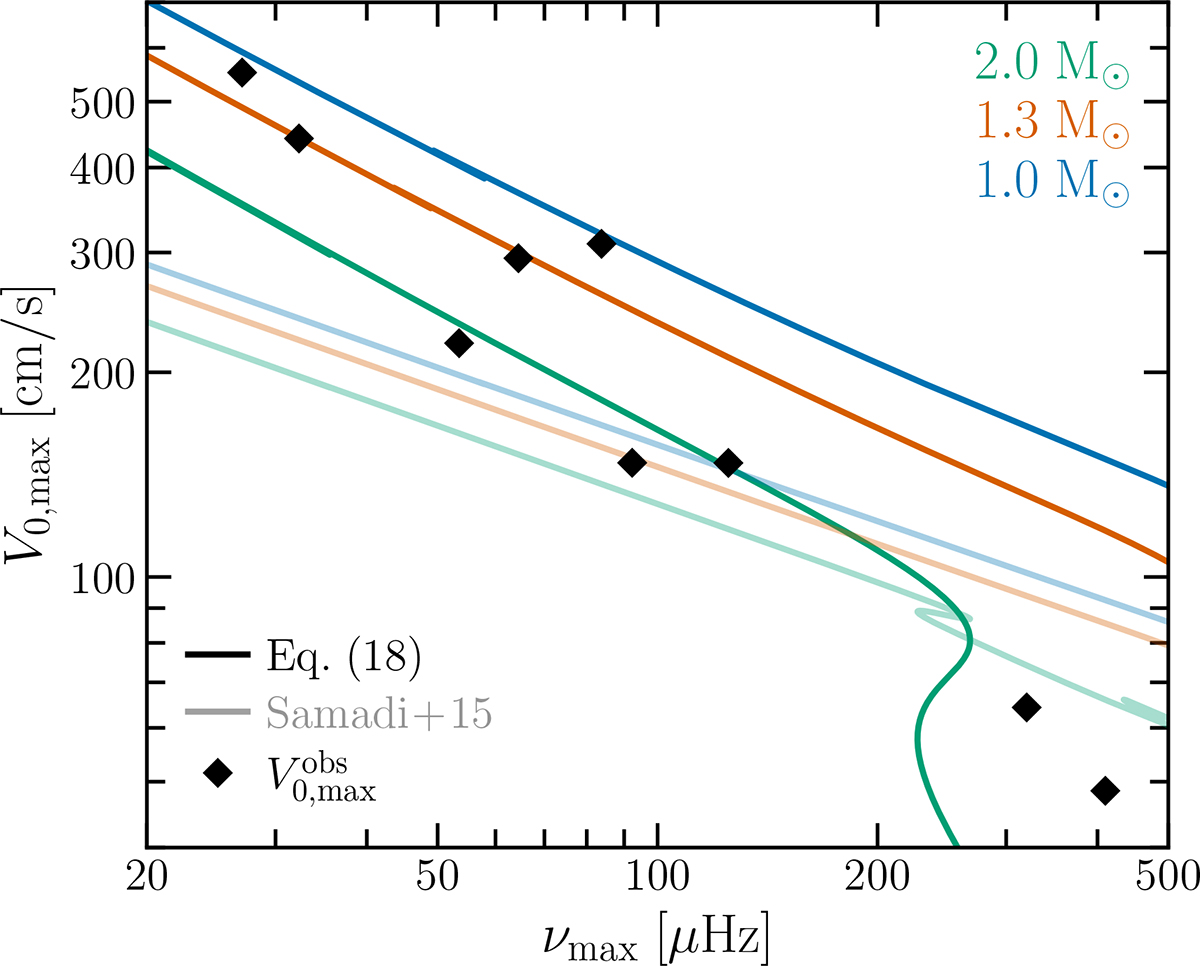
Radial mode surface velocities (logarithmic scale) as a function of the frequency at maximum oscillation power, νmax (logarithmic scale). The fully opaque lines represent models evaluated using Eq. (18). The semi-transparent lines show models evaluated using Eq. (5.21) from Samadi et al. (2015). The colour represent the masses of the evolutionary tracks. The black diamonds show the ground-based Doppler velocity measurements compiled by Samadi et al. (2012).
Current usage metrics show cumulative count of Article Views (full-text article views including HTML views, PDF and ePub downloads, according to the available data) and Abstracts Views on Vision4Press platform.
Data correspond to usage on the plateform after 2015. The current usage metrics is available 48-96 hours after online publication and is updated daily on week days.
Initial download of the metrics may take a while.