Fig. A.1
Download original image
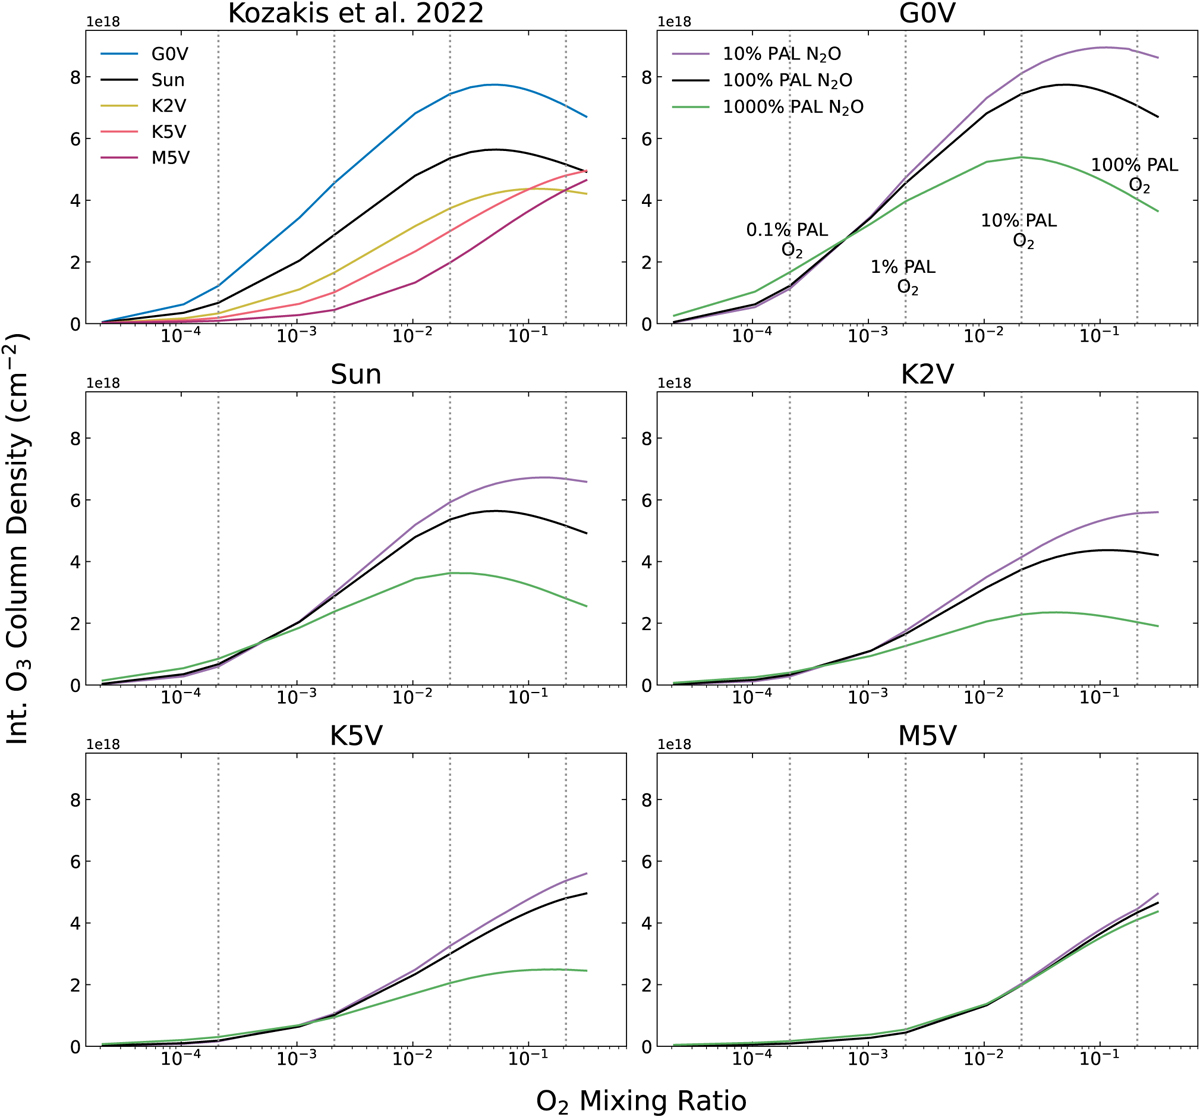
O2-O3 relationship for changing N2O, along with models from Kozakis et al. (2022) for comparison, for all modeled O2 mixing ratios. Vertical dashed lines indicate O2 levels of 100%, 10%, 1%, and 0.1% PAL. All plots share the same y-axis to facilitate comparison between different host stars. The phenomena that causes the peak O3 value for G0V-, Sun-, and K2V-hosted planets to occur at O2 levels less than the maximum value modeled (150% PAL O2) is discussed at length in Kozakis et al. (2022).
Current usage metrics show cumulative count of Article Views (full-text article views including HTML views, PDF and ePub downloads, according to the available data) and Abstracts Views on Vision4Press platform.
Data correspond to usage on the plateform after 2015. The current usage metrics is available 48-96 hours after online publication and is updated daily on week days.
Initial download of the metrics may take a while.