Fig. 4
Download original image
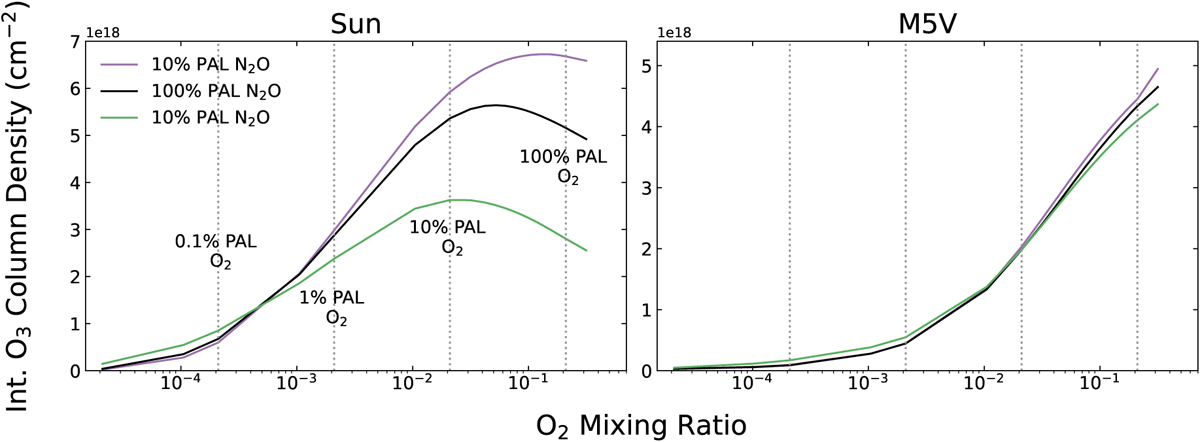
O2-O3 relationship with high, low, and modern N2O models for planets around the Sun and M5V hosts. Vertical dashed lines indicate O2 levels of 100%, 10%, 1%, and 0.1% PAL. The phenomena causing maximum O3 production for the planet around the Sun to occur at O2 values less than the maximum O2 value modeled are explained in depth in Kozakis et al. (2022). In general, the M5V-hosted planet experiences significantly less variation in O3 for different N2O abundances than the Sun-hosted planet because the low UV flux of the M5V host is not as efficient at converting N2O into NOx as other hosts with higher UV fluxes. O2-O3 relationships for planets around all hosts and comparisons to Kozakis et al. (2022) are in Figure A.1.
Current usage metrics show cumulative count of Article Views (full-text article views including HTML views, PDF and ePub downloads, according to the available data) and Abstracts Views on Vision4Press platform.
Data correspond to usage on the plateform after 2015. The current usage metrics is available 48-96 hours after online publication and is updated daily on week days.
Initial download of the metrics may take a while.