Fig. 6.
Download original image
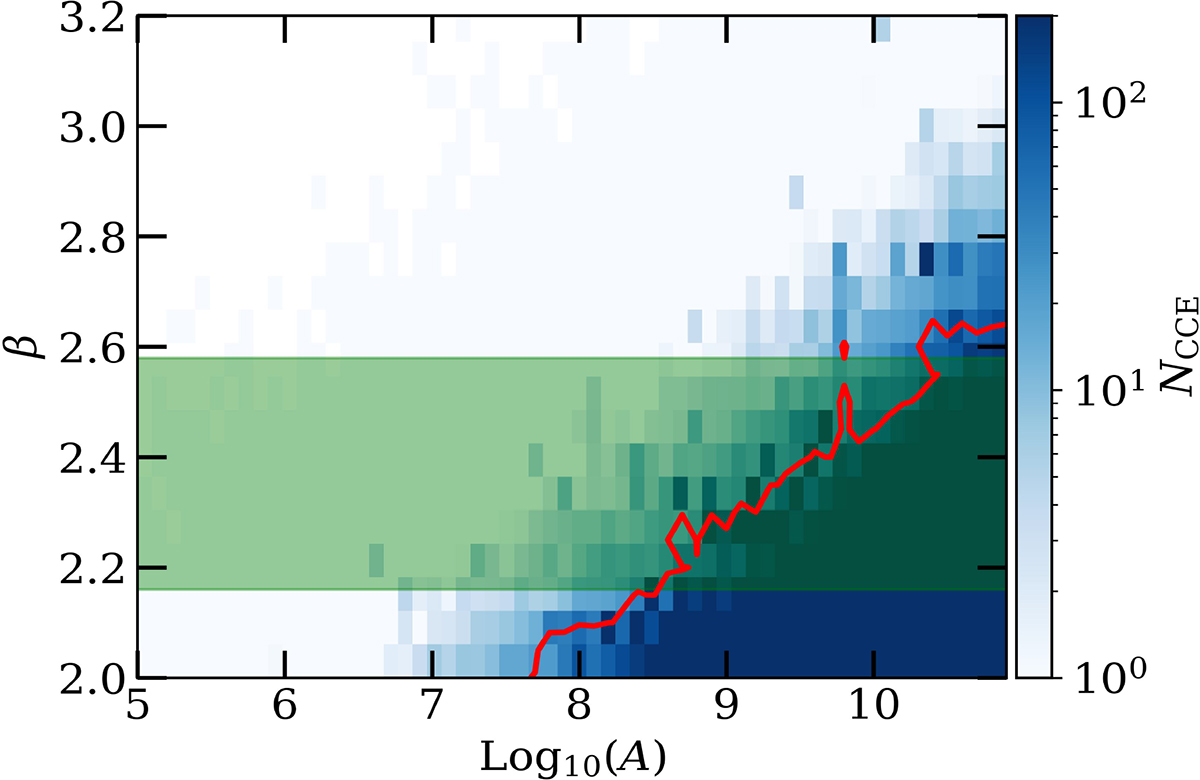
Total number of CCEs assuming a power-law luminosity function. The background color map represents the total number of expected CCEs during Flashlights observations in all of the lensed arcs considered in the current work. The red curve corresponds to NCCE = 20, i.e., the number of events observed in Flashlights. The shaded green region represents the best-fit β value with 1σ range, i.e., β = 2.37±0.21 (see Sect. 4.2 for more details).
Current usage metrics show cumulative count of Article Views (full-text article views including HTML views, PDF and ePub downloads, according to the available data) and Abstracts Views on Vision4Press platform.
Data correspond to usage on the plateform after 2015. The current usage metrics is available 48-96 hours after online publication and is updated daily on week days.
Initial download of the metrics may take a while.