Fig. 5.
Download original image
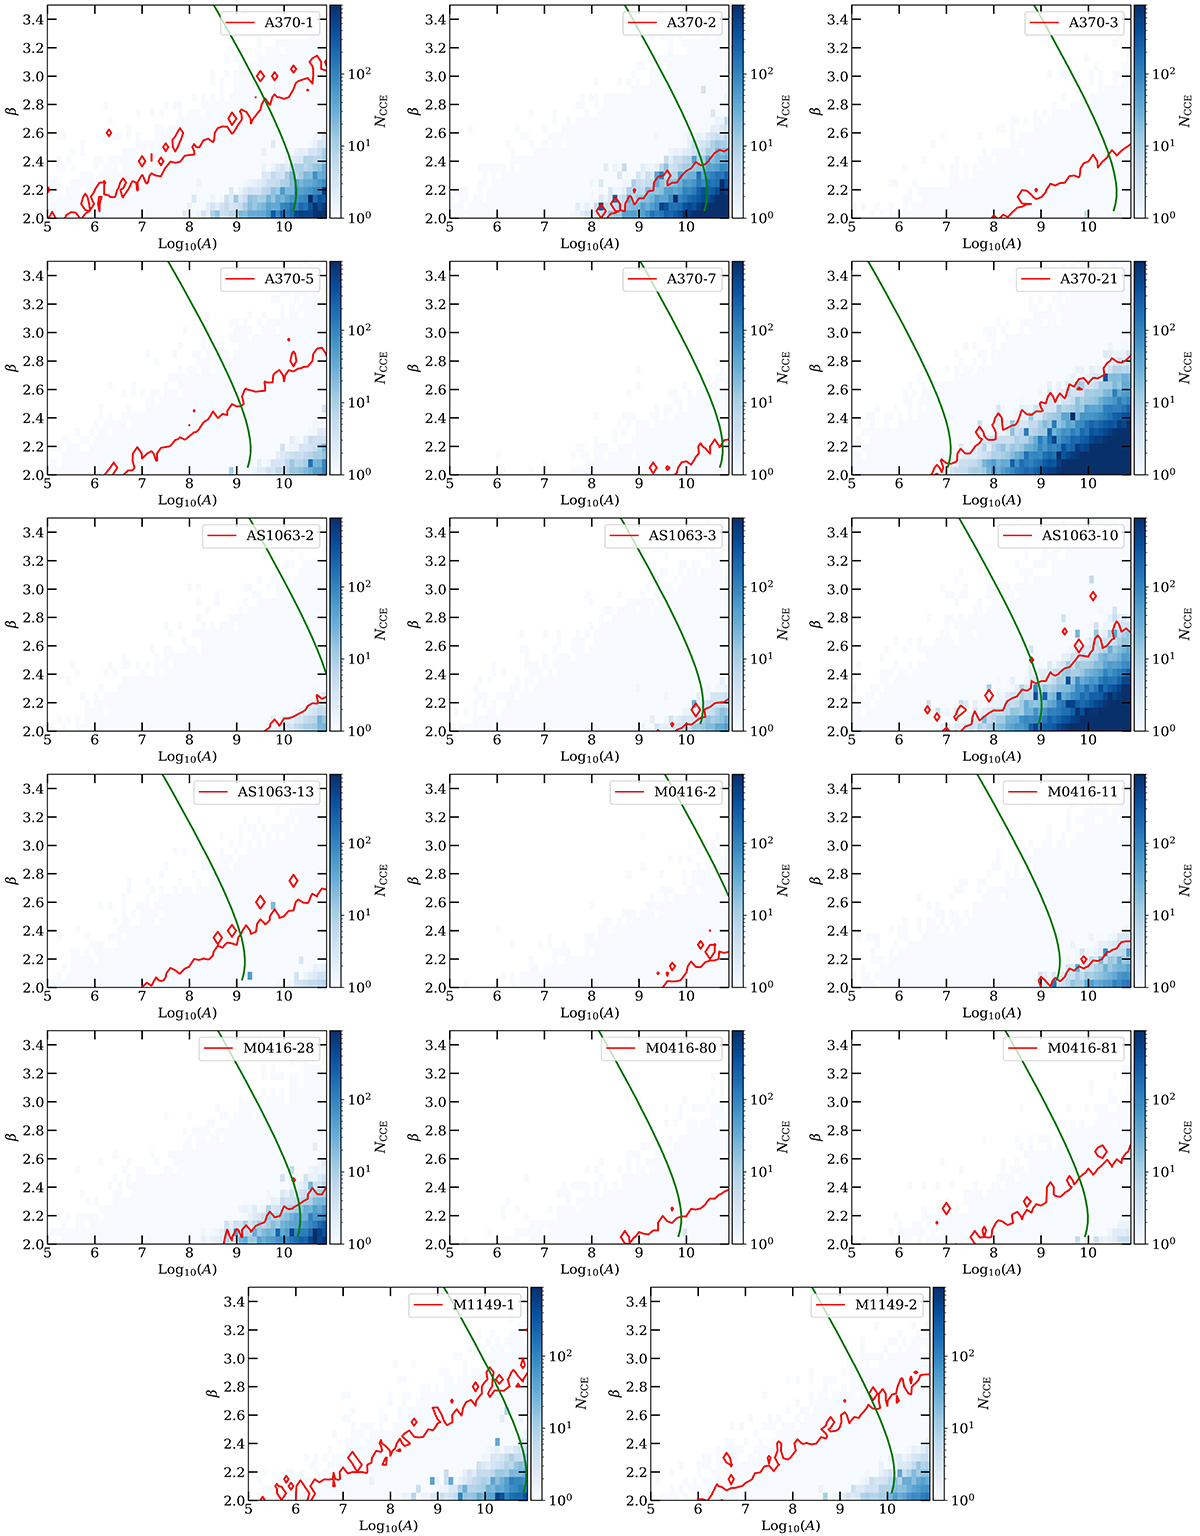
Number of CCEs in each arc assuming a power-law luminosity function. In each panel, the background color map represents the number of estimated CCEs given the value for (A,β) shown on the abscissa and ordinate axes. The red curve represents the number of observed CCEs. For arcs where we did not observe any CCEs, the red curve corresponds to NCCE = 0.001. In each panel, the green curves mark the (A,β) value that leads to a total luminosity equal to the observed lensing-corrected luminosity in F200LP, and the crossing point of green and red curves denotes the best-fit luminosity function slope (β) value for that particular arc.
Current usage metrics show cumulative count of Article Views (full-text article views including HTML views, PDF and ePub downloads, according to the available data) and Abstracts Views on Vision4Press platform.
Data correspond to usage on the plateform after 2015. The current usage metrics is available 48-96 hours after online publication and is updated daily on week days.
Initial download of the metrics may take a while.