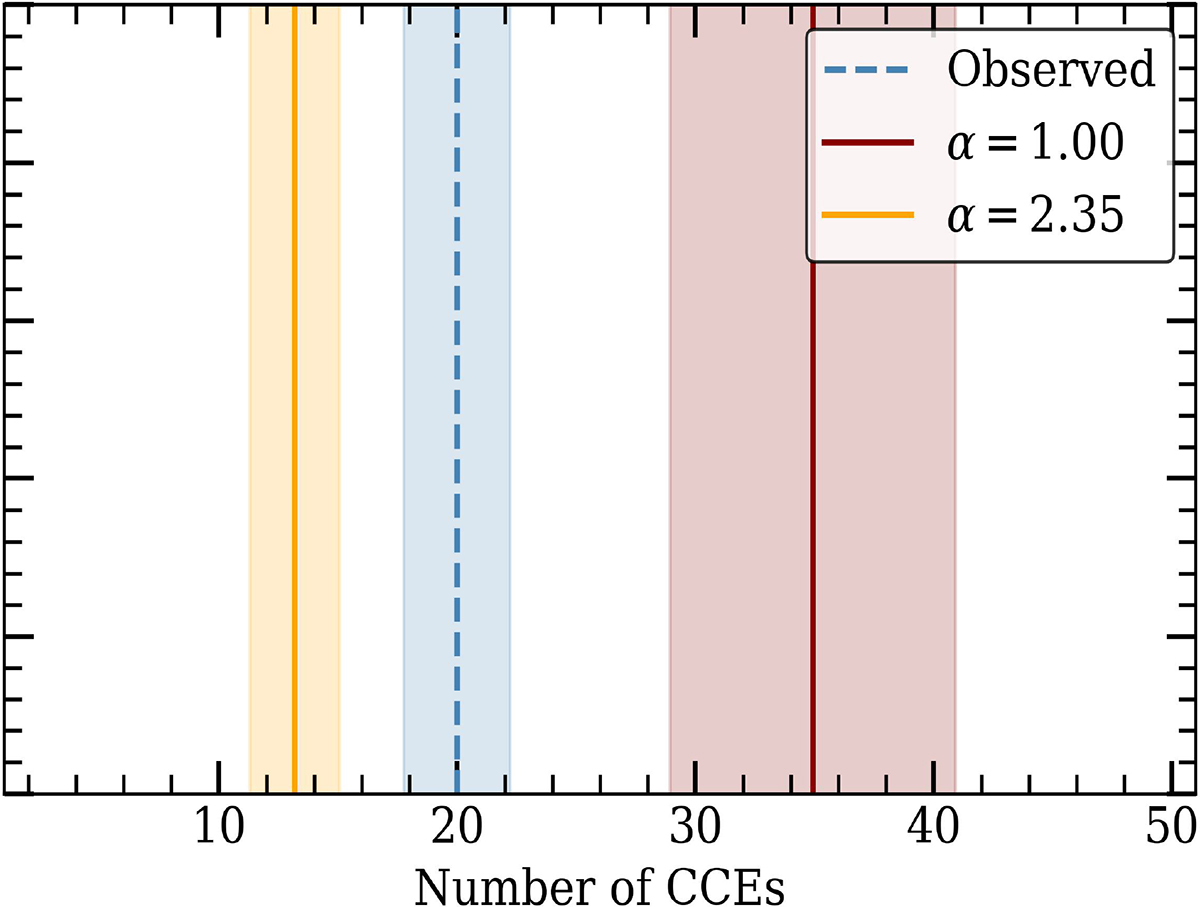
Fig. 4.
Download original image
Predicted number of CCEs in the Flashlights survey for two different IMFs used in the current work. The vertical blue dashed line represents the observed number of transients in Flashlights, and the shaded region around it marks the 1σ Poisson error. The yellow and red vertical lines represent the expected number of CCEs in the Flashlights survey for Salpeter (α = 2.35) and top-heavy (α = 1.0) IMFs, respectively, and the shaded region around these lines marks the 1σ uncertainties.
Current usage metrics show cumulative count of Article Views (full-text article views including HTML views, PDF and ePub downloads, according to the available data) and Abstracts Views on Vision4Press platform.
Data correspond to usage on the plateform after 2015. The current usage metrics is available 48-96 hours after online publication and is updated daily on week days.
Initial download of the metrics may take a while.