Fig. 3.
Download original image
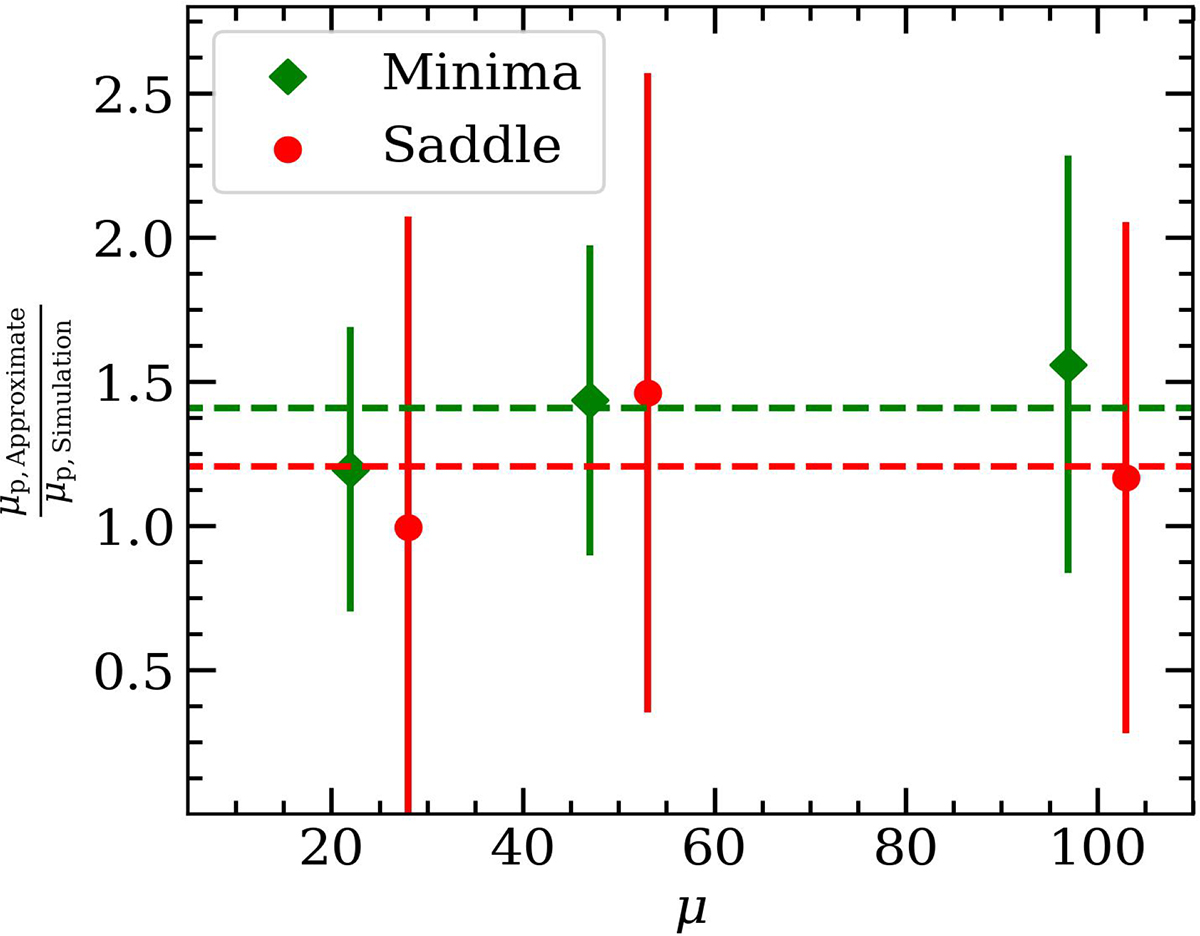
Comparison between peak magnification. The abscissa and ordinate axes represent the macromagnification in the image plane and the ratio of peak magnifications estimated using Eq. (3) and average peak magnification from simulations, respectively. The solid green diamonds and red circles correspond to the minima and saddle sides of the macrocritical curve, respectively. The error bars represent the 1σ variation in peak magnification around the average value in simulations. The horizontal dashed curves represent the average of the solid points in the same color.
Current usage metrics show cumulative count of Article Views (full-text article views including HTML views, PDF and ePub downloads, according to the available data) and Abstracts Views on Vision4Press platform.
Data correspond to usage on the plateform after 2015. The current usage metrics is available 48-96 hours after online publication and is updated daily on week days.
Initial download of the metrics may take a while.