Fig. 2.
Download original image
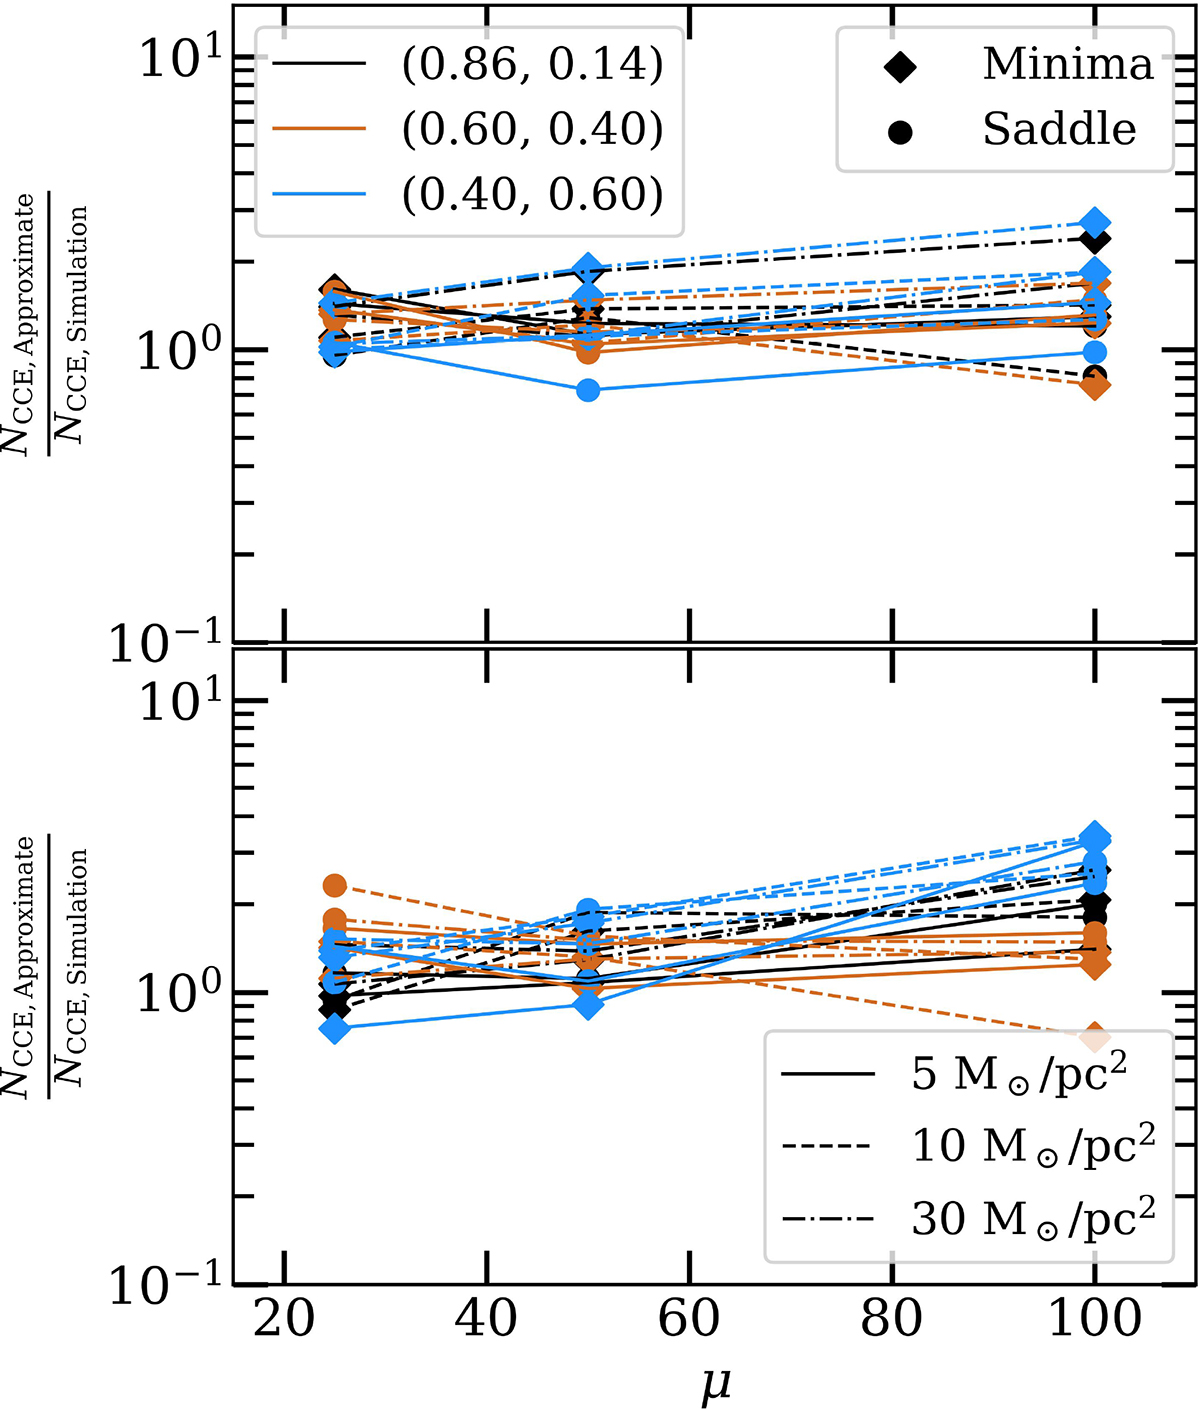
Validation of our simplified method for calculating the rate of CCEs. The abscissa and ordinate axes represent the macromagnification in the image plane and the ratio of the approximate number of CCEs estimated using our method to the number of CCEs from explicit ray-tracing simulations, respectively. We show a comparison for three stellar density values. The top (bottom) panel indicates this ratio for a source moving along the ϕ = 0 (ϕ=π/2) path. As can be seen, the number of predicted CCEs from our simplified method overall agrees well with the estimates from the explicit simulation, overestimating the number of events by a factor of 1–3 – mainly due to the fact that in reality, some microcaustics would merge into larger caustics, which is not taken into account in our calculation.
Current usage metrics show cumulative count of Article Views (full-text article views including HTML views, PDF and ePub downloads, according to the available data) and Abstracts Views on Vision4Press platform.
Data correspond to usage on the plateform after 2015. The current usage metrics is available 48-96 hours after online publication and is updated daily on week days.
Initial download of the metrics may take a while.