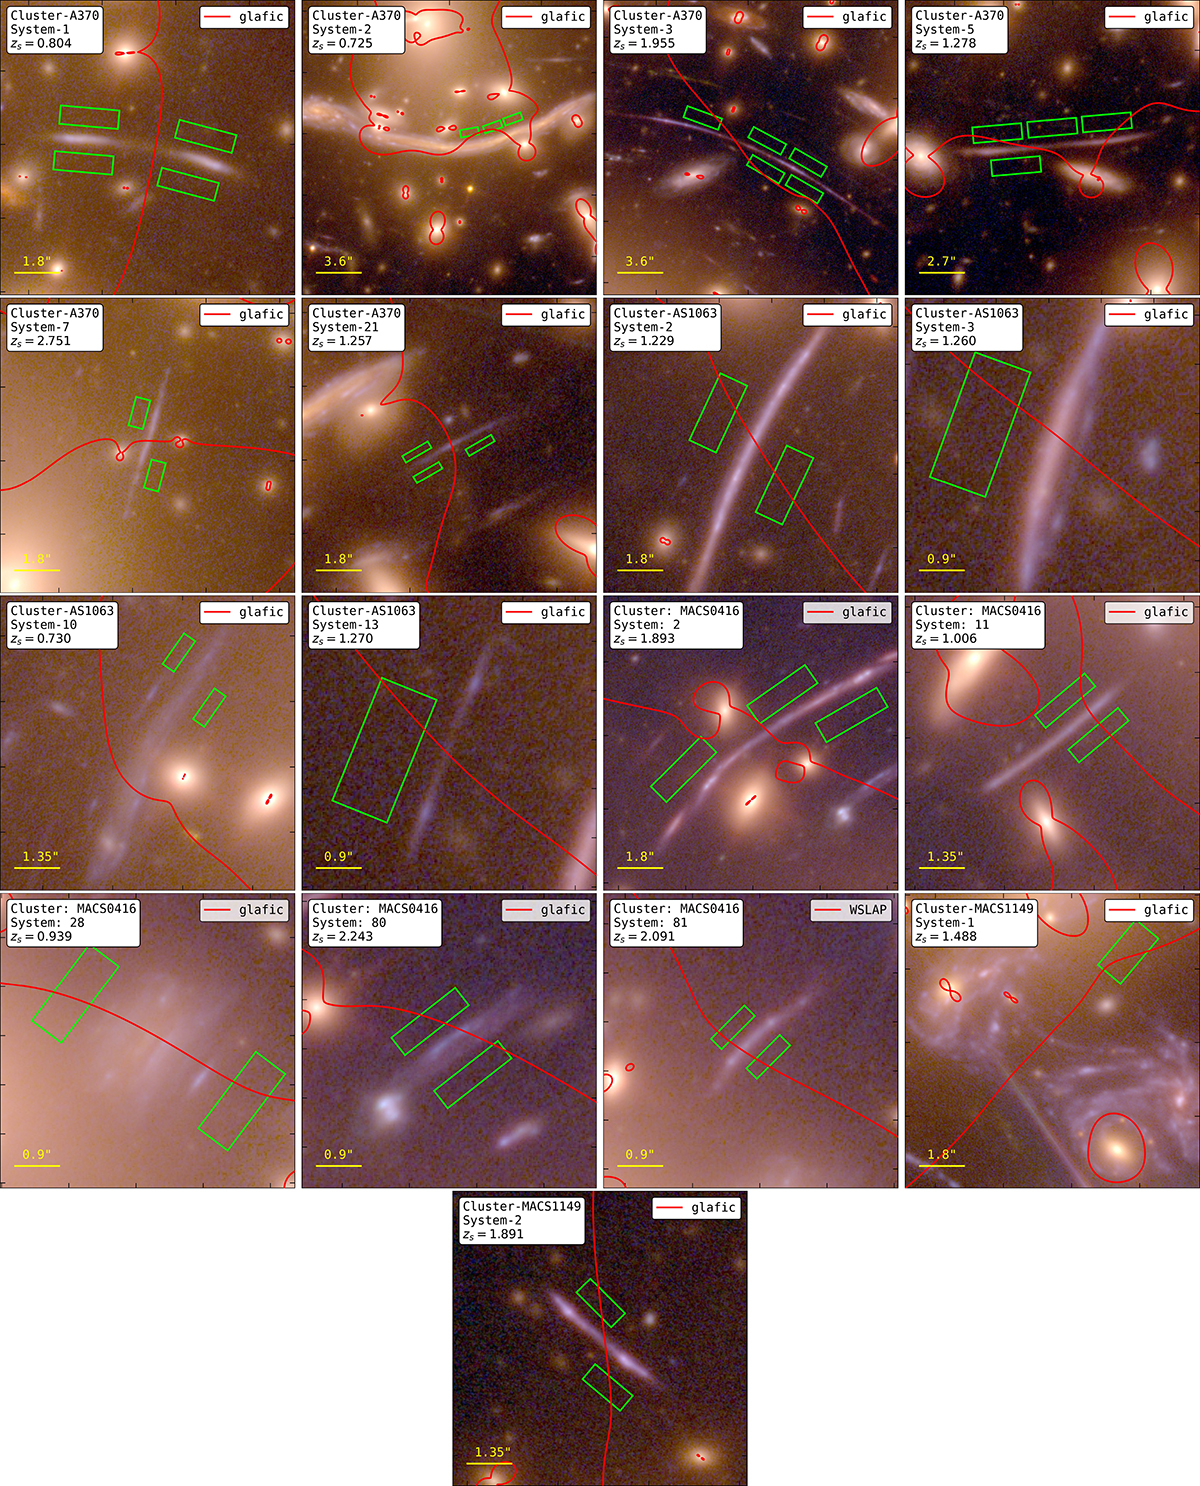
Fig. 1.
Download original image
Lensed arcs studied in our current work. In each panel, the name of the galaxy cluster, lensed arc system number (same as shown in Table A.1), and arc redshift are given in the upper-left part. The red curves show the critical curve at the arc redshift corresponding to the lens model (mentioned in the upper-right part of the panel) used in the current work for various estimates for each arc. The green rectangles mark apertures used to estimate the ICL density near each arc. The color images are made using HFF data with R = F105W+F125W+140W+160W; G = F606W+F814W+F105W; B = F435W+F606W.
Current usage metrics show cumulative count of Article Views (full-text article views including HTML views, PDF and ePub downloads, according to the available data) and Abstracts Views on Vision4Press platform.
Data correspond to usage on the plateform after 2015. The current usage metrics is available 48-96 hours after online publication and is updated daily on week days.
Initial download of the metrics may take a while.