Fig. B.1
Download original image
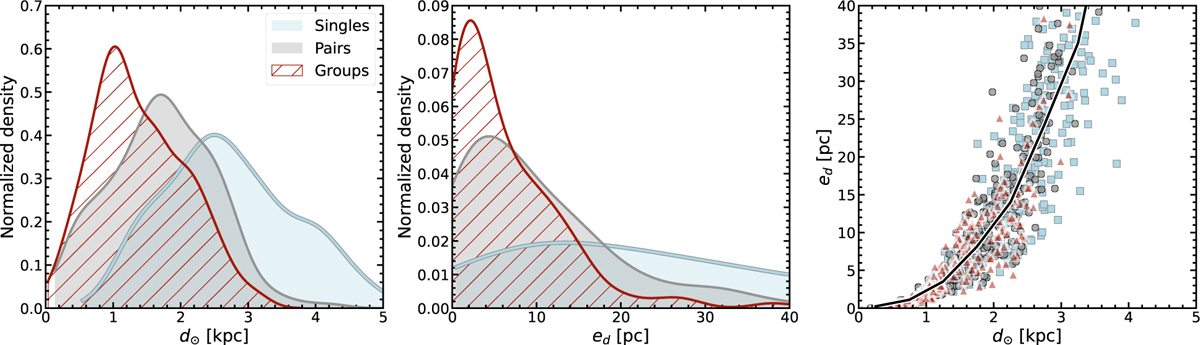
Left and central panels: Distributions of OCs’ distances to the Sun (dʘ) and their errors (ed). Right panel: Relationship between distance and the corresponding error. The black curve indicates the trend of mean values. Colours in all panels follow those in Fig. 1. We estimated ed using the 16% and 84% quantiles of distances from the Hunt & Reffert (2024) database.
Current usage metrics show cumulative count of Article Views (full-text article views including HTML views, PDF and ePub downloads, according to the available data) and Abstracts Views on Vision4Press platform.
Data correspond to usage on the plateform after 2015. The current usage metrics is available 48-96 hours after online publication and is updated daily on week days.
Initial download of the metrics may take a while.