Open Access
Fig. 6
Download original image
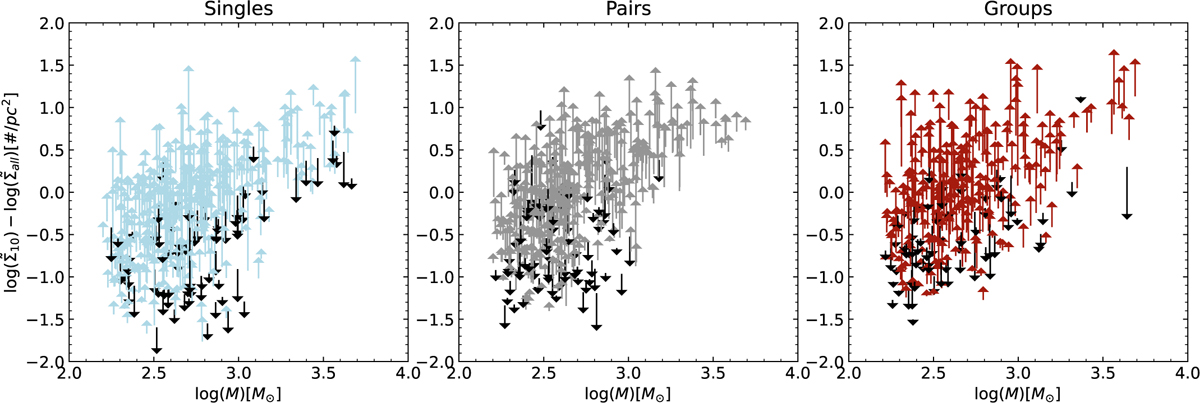
Local density ratio as a function of total mass for (from left to right): single OCs, OCs in pairs, and OCs in groups. Upward arrows indicate OCs with mass segregation, while black downward arrows indicate OCs with inverse mass segregation.
Current usage metrics show cumulative count of Article Views (full-text article views including HTML views, PDF and ePub downloads, according to the available data) and Abstracts Views on Vision4Press platform.
Data correspond to usage on the plateform after 2015. The current usage metrics is available 48-96 hours after online publication and is updated daily on week days.
Initial download of the metrics may take a while.