Fig. 5
Download original image
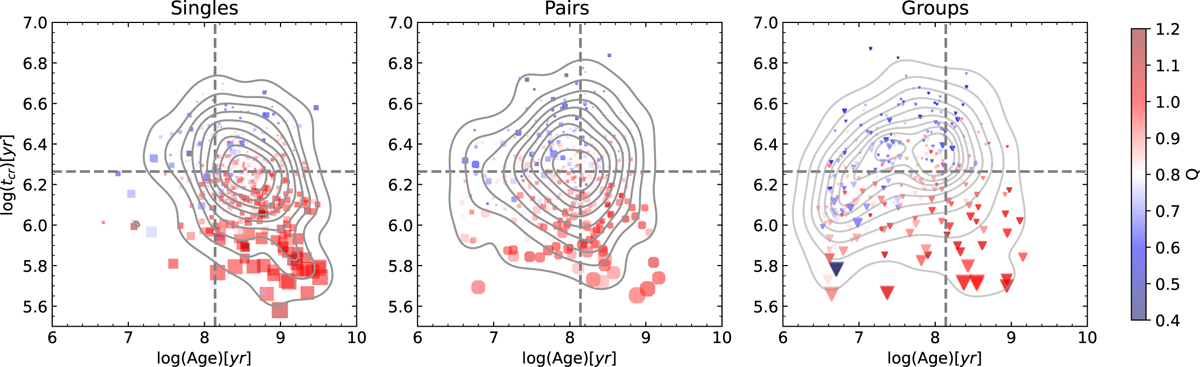
Crossing time (tcr) as a function of system age for (from left to right): single OCs, OCs in pairs, and OCs in groups. Symbol sizes corresponds to total mass, and dots are colour-coded by their Q parameter value. Vertical and horizontal dashed grey lines indicate the median values of age and crossing time for the entire sample, respectively. Solid grey lines represent iso-density contours.
Current usage metrics show cumulative count of Article Views (full-text article views including HTML views, PDF and ePub downloads, according to the available data) and Abstracts Views on Vision4Press platform.
Data correspond to usage on the plateform after 2015. The current usage metrics is available 48-96 hours after online publication and is updated daily on week days.
Initial download of the metrics may take a while.