Fig. 4
Download original image
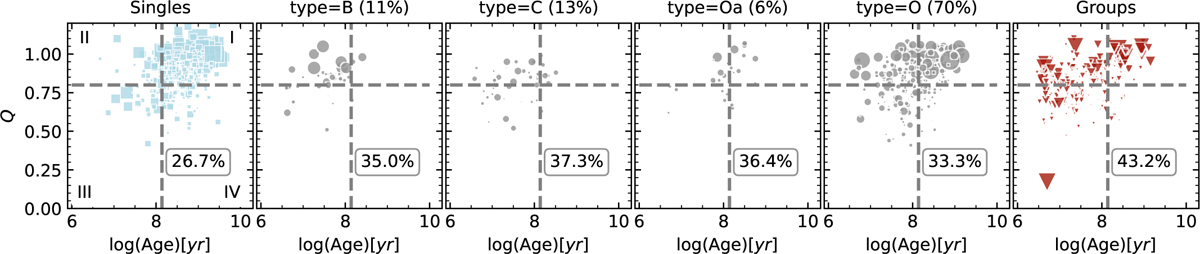
Q parameter as a function of age for (from left to right): singles, pair subtypes B, C, Oa, and O, and groups. The percentages in the panel titles represent the fraction of each pair type relative to the total. The percentages in the boxes indicate the fraction of OCs with Q < 0.8. Marker sizes correspond to total mass. The horizontal dashed grey line marks Q = 0.8, while the vertical dashed grey lines indicate the median age of the pairs in the OC system (log(Age)[yr] = 8.1). In the left panel, we divide the plane into four quadrants, labelled I to IV.
Current usage metrics show cumulative count of Article Views (full-text article views including HTML views, PDF and ePub downloads, according to the available data) and Abstracts Views on Vision4Press platform.
Data correspond to usage on the plateform after 2015. The current usage metrics is available 48-96 hours after online publication and is updated daily on week days.
Initial download of the metrics may take a while.