Fig. 3
Download original image
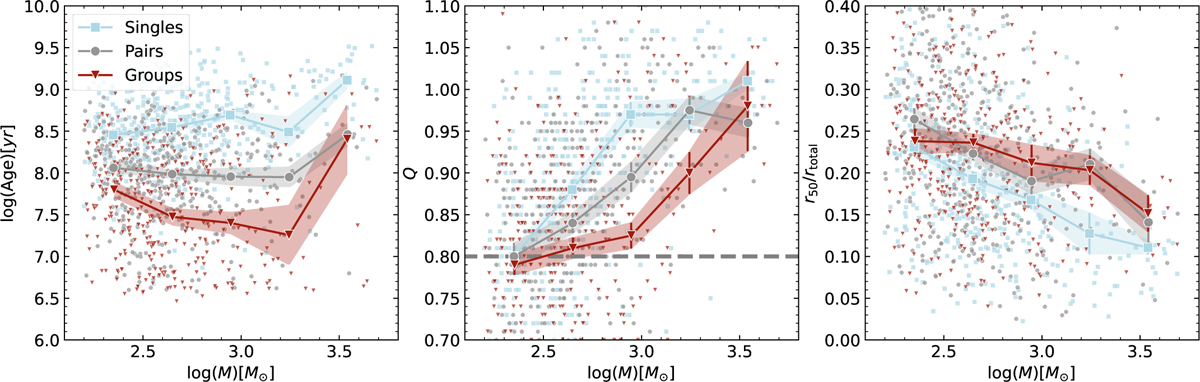
Median properties of OCs as a function of total mass (from left to right): age, Q values, and concentration. Single OCs are represented by light blue squares, pairs by grey circles, and OCs in groups by red triangles. Shaded areas indicate errors obtained via the bootstrap resampling technique. The horizontal dashed grey line in the central panel corresponds to Q = 0.8.
Current usage metrics show cumulative count of Article Views (full-text article views including HTML views, PDF and ePub downloads, according to the available data) and Abstracts Views on Vision4Press platform.
Data correspond to usage on the plateform after 2015. The current usage metrics is available 48-96 hours after online publication and is updated daily on week days.
Initial download of the metrics may take a while.