Fig. 3
Download original image
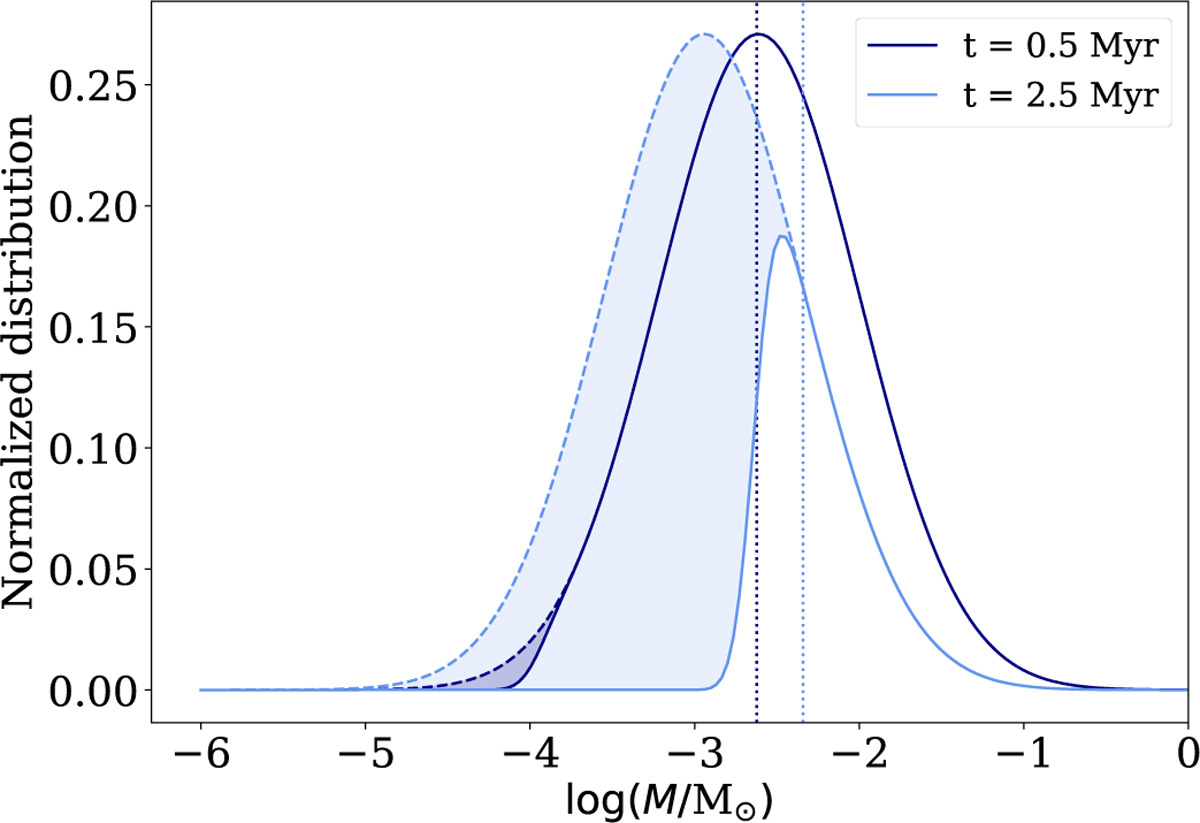
Disc mass distribution at 0.5 Myr and 2.5 Myr for the viscousphotoevaporative model (solid line), compared with purely viscous distributions (dashed line). The dotted vertical lines indicate the medians of the distributions of survived discs, while the hatched regions correspond to dispersed discs. This population has ![]() , and
, and ![]() , where all quantities follow log-normal distributions with σ = 0.5 dex.
, where all quantities follow log-normal distributions with σ = 0.5 dex.
Current usage metrics show cumulative count of Article Views (full-text article views including HTML views, PDF and ePub downloads, according to the available data) and Abstracts Views on Vision4Press platform.
Data correspond to usage on the plateform after 2015. The current usage metrics is available 48-96 hours after online publication and is updated daily on week days.
Initial download of the metrics may take a while.