Fig. 2
Download original image
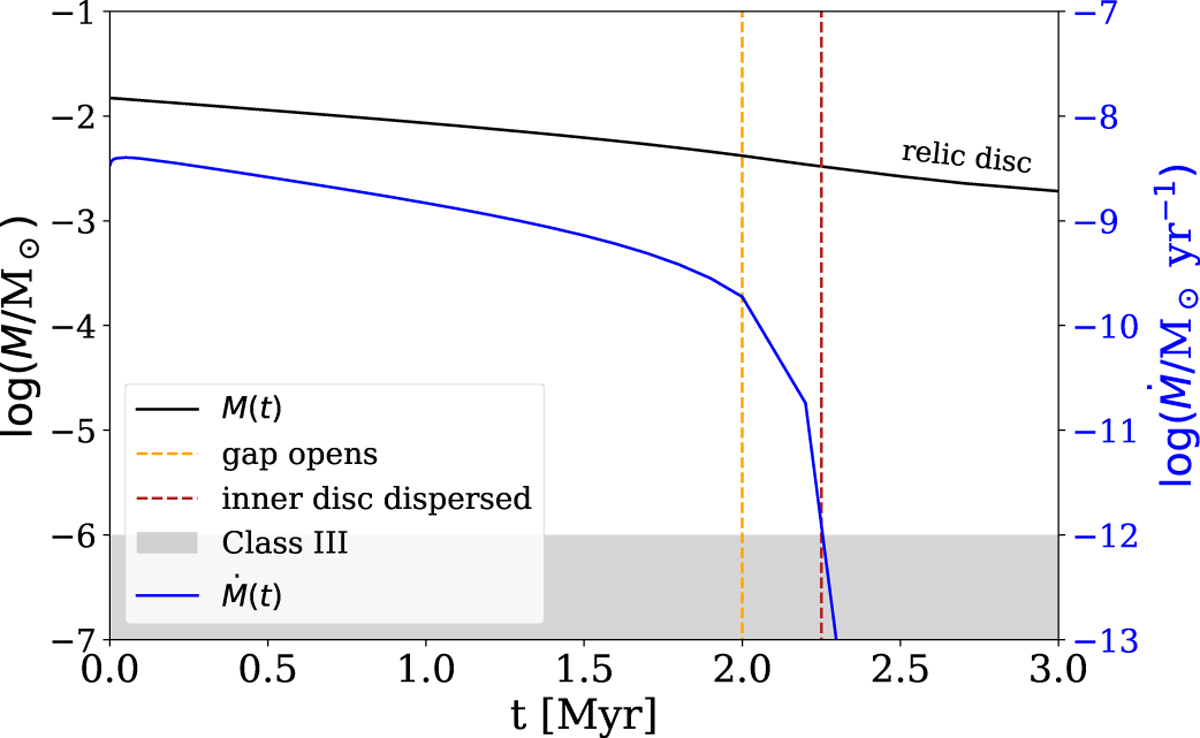
Evolution of the accretion rate (blue) and mass (black) of a disc over time. The vertical yellow line indicates the instant when the gap opens, which triggers a steep decrease in ![]() . The red line marks the transition between accreting and non-accreting phases. The grey region corresponds to values of disc mass and accretion rate below the respective observational threshold.
. The red line marks the transition between accreting and non-accreting phases. The grey region corresponds to values of disc mass and accretion rate below the respective observational threshold.
Current usage metrics show cumulative count of Article Views (full-text article views including HTML views, PDF and ePub downloads, according to the available data) and Abstracts Views on Vision4Press platform.
Data correspond to usage on the plateform after 2015. The current usage metrics is available 48-96 hours after online publication and is updated daily on week days.
Initial download of the metrics may take a while.