Open Access
Fig. 15
Download original image
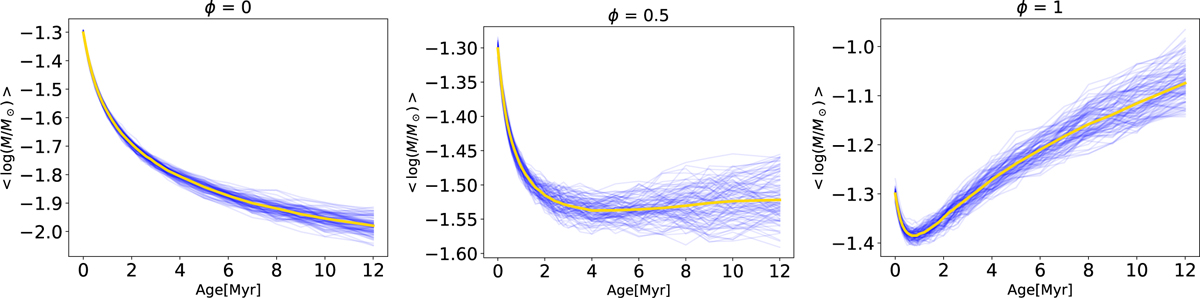
Evolution of the median mass as a function of time for two sets of populations evolved according to the MHD wind model, with ϕ = 0 (left panel), ϕ = 0.5 (central panel), and ϕ = 1 (right panel). The gold lines represent the medians of all the simulations with the same ϕ value.
Current usage metrics show cumulative count of Article Views (full-text article views including HTML views, PDF and ePub downloads, according to the available data) and Abstracts Views on Vision4Press platform.
Data correspond to usage on the plateform after 2015. The current usage metrics is available 48-96 hours after online publication and is updated daily on week days.
Initial download of the metrics may take a while.