Open Access
Fig. 12
Download original image
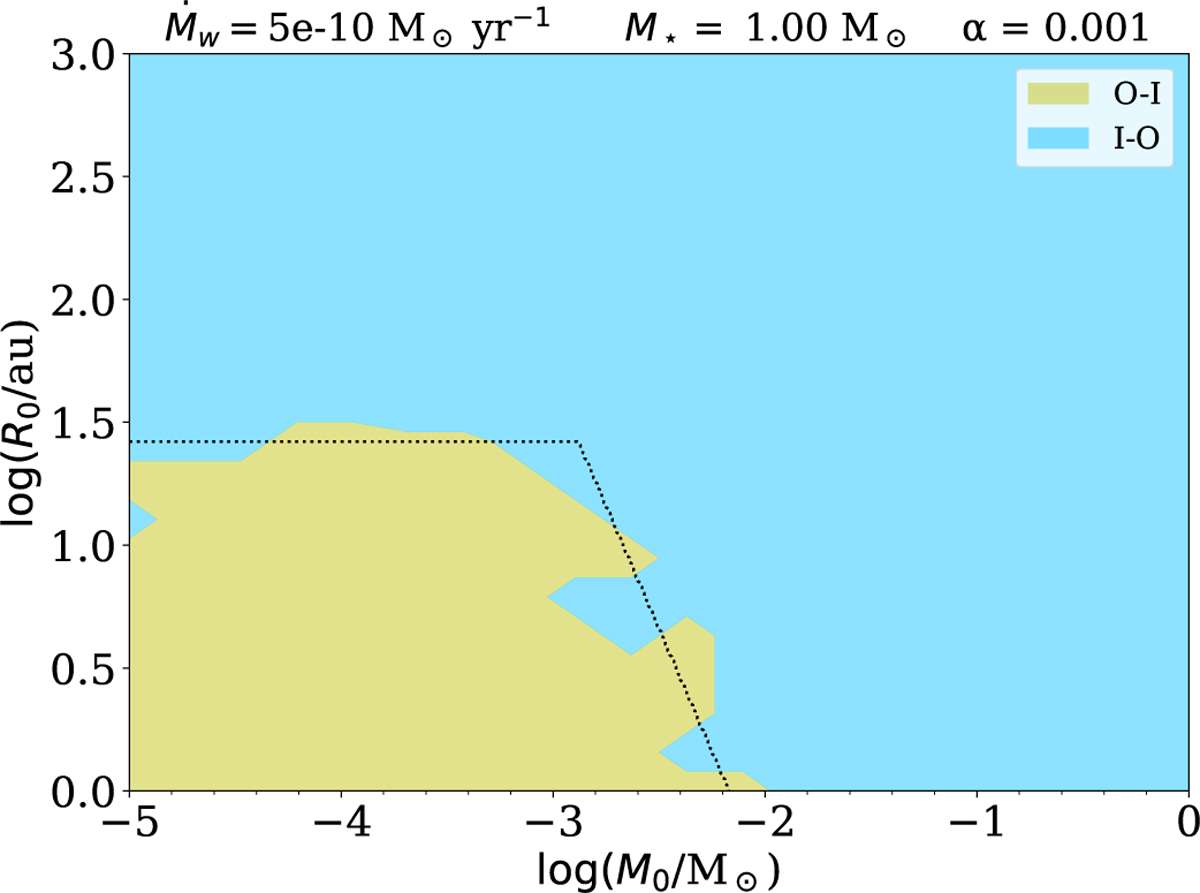
Numerical test of Eq. (32). The colours represent the regions of the R0–M0 plane where numerical discs are dispersed from outside-in (in yellow) or from inside-out (in blue). The dotted line represents the analytical boundary between these two regimes.
Current usage metrics show cumulative count of Article Views (full-text article views including HTML views, PDF and ePub downloads, according to the available data) and Abstracts Views on Vision4Press platform.
Data correspond to usage on the plateform after 2015. The current usage metrics is available 48-96 hours after online publication and is updated daily on week days.
Initial download of the metrics may take a while.