Fig. 9
Download original image
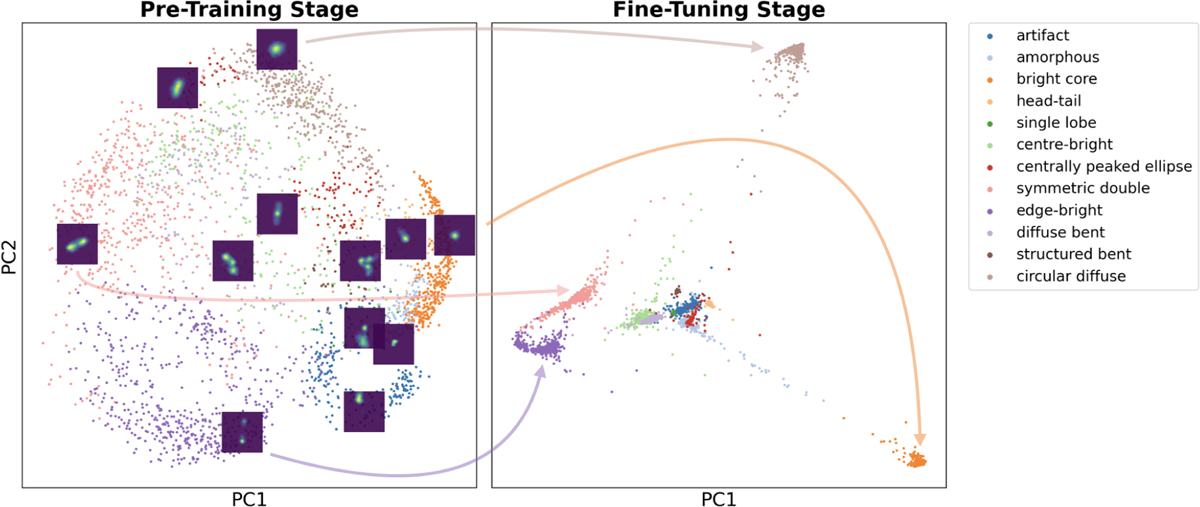
Representations of sources from the labelled subsample within the space defined by the first two principal components, with colours corresponding to cluster labels as listed in the legend. Left: representations from the pre-training stage are displayed, showing a dispersed distribution pattern. Additionally, a representative image from each cluster is provided to highlight the morphological structure within the distribution. Right: post fine-tuning representations are presented, demonstrating compact clustering according to the labels. Arrows are included to depict the evolution of selected clusters from the pre-training to the fine-tuning stage.
Current usage metrics show cumulative count of Article Views (full-text article views including HTML views, PDF and ePub downloads, according to the available data) and Abstracts Views on Vision4Press platform.
Data correspond to usage on the plateform after 2015. The current usage metrics is available 48-96 hours after online publication and is updated daily on week days.
Initial download of the metrics may take a while.