Open Access
Fig. 4
Download original image
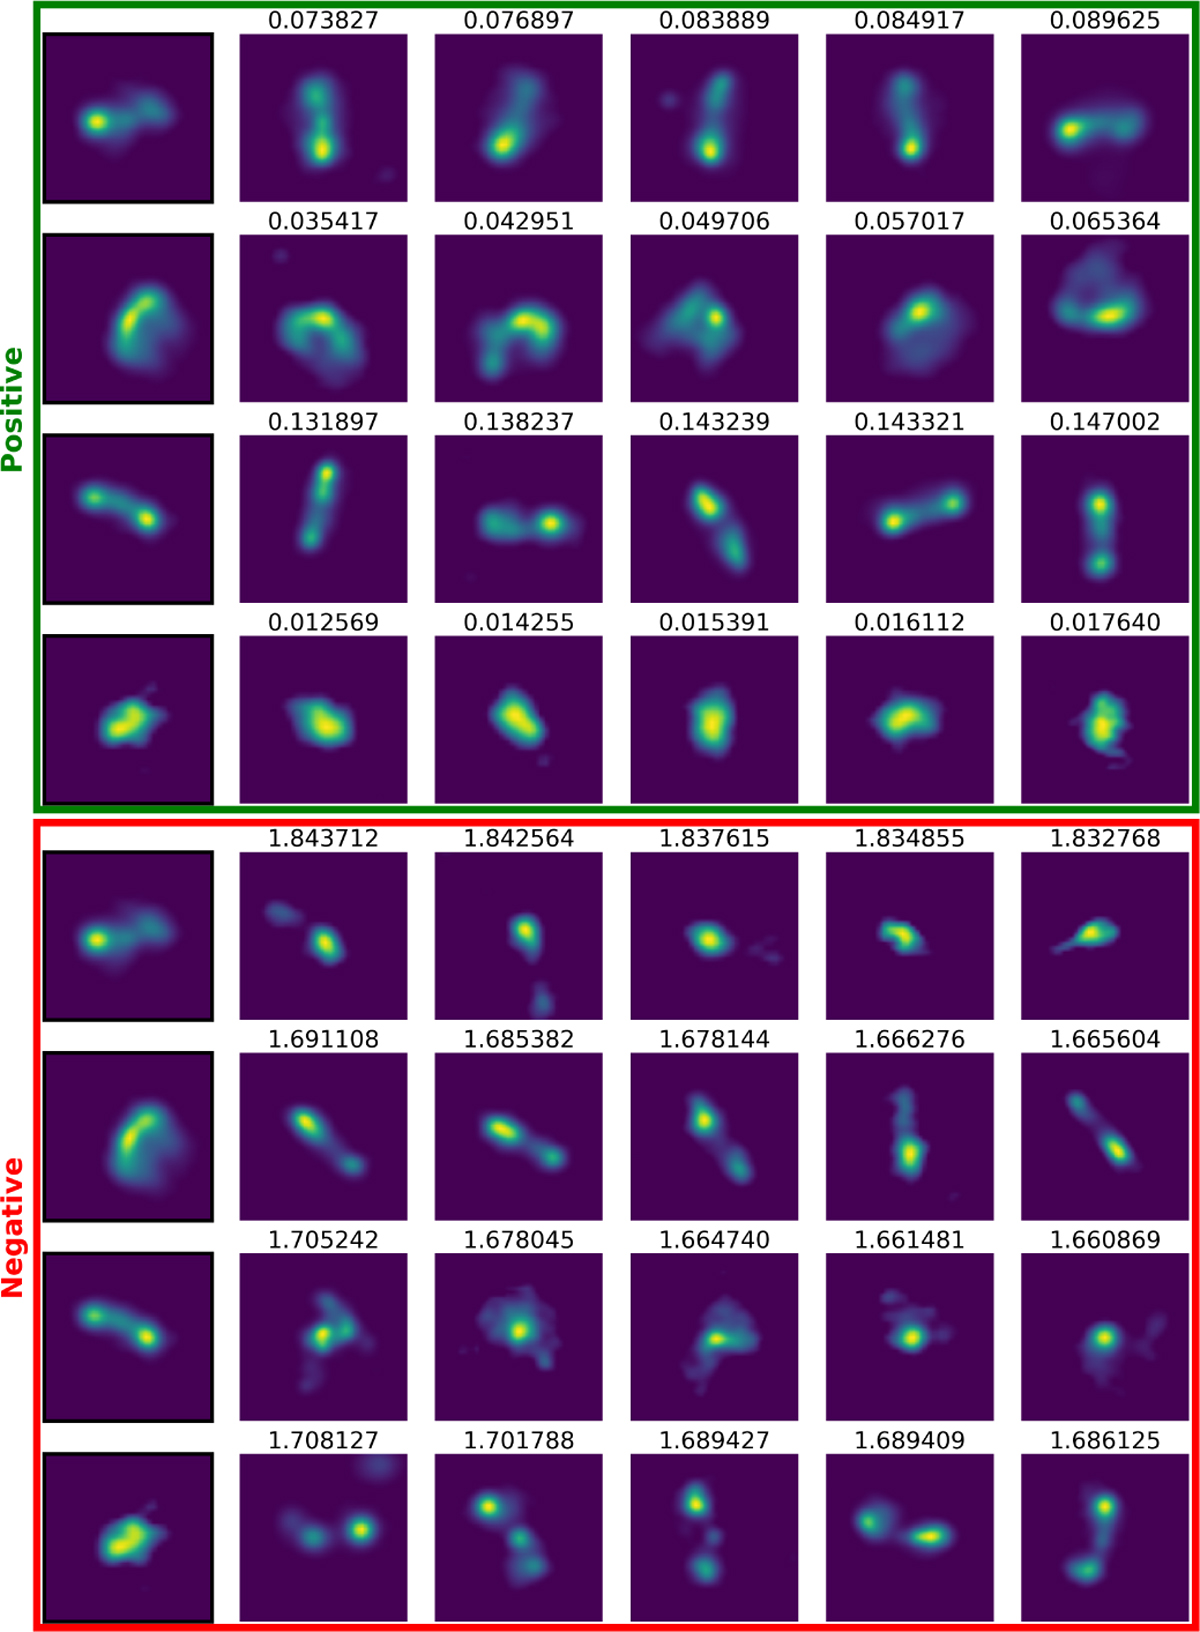
Query images, shown in the first column. The first four rows show the five nearest neighbours based on cosine distance, while the last four rows display the five farthest representations. Above each neighbour, the corresponding cosine distance value is shown.
Current usage metrics show cumulative count of Article Views (full-text article views including HTML views, PDF and ePub downloads, according to the available data) and Abstracts Views on Vision4Press platform.
Data correspond to usage on the plateform after 2015. The current usage metrics is available 48-96 hours after online publication and is updated daily on week days.
Initial download of the metrics may take a while.