Fig. C.2
Download original image
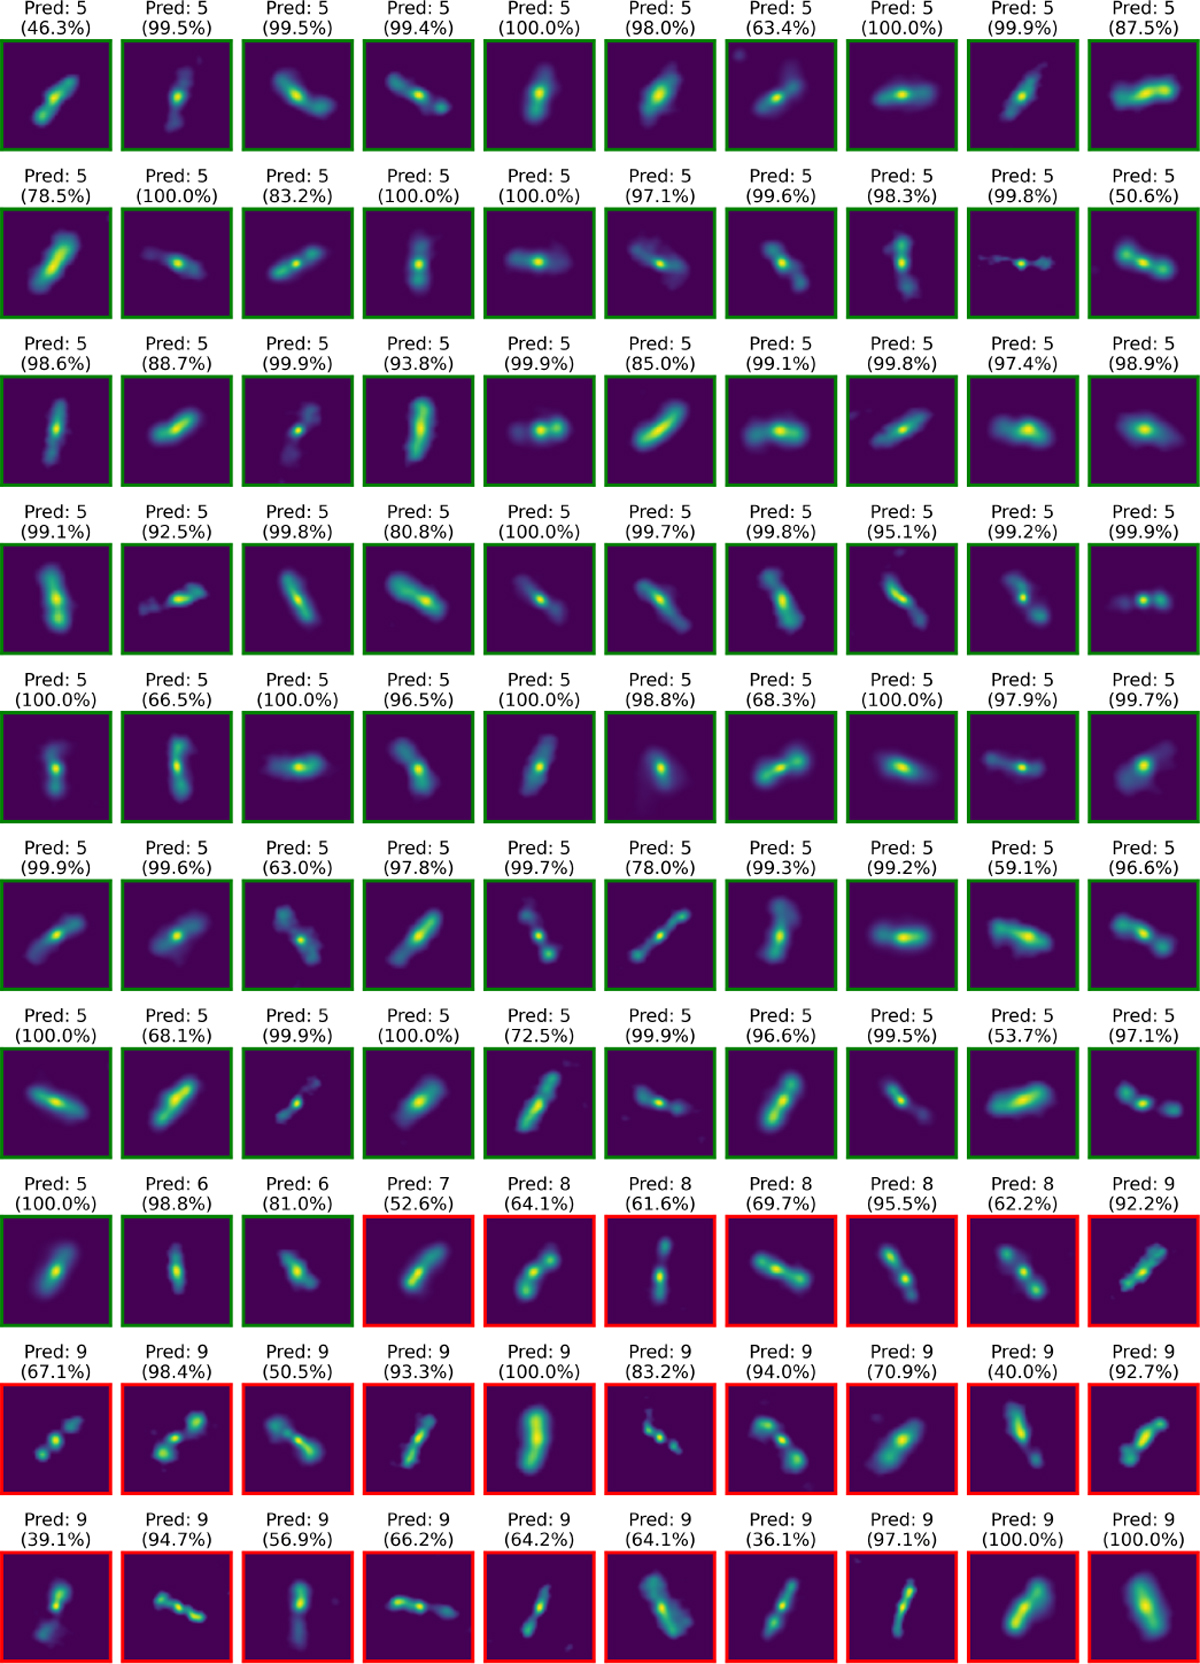
Image grid displaying the 100 sources manually labelled as FRI, accompanied by the class and class probability predicted by our model. Sources with predicted labels compatible with FRI (centre-bright or centrally peaked ellipse) are framed in green, whereas those with different predicted labels are framed in red. The predicted class number corresponds to those shown in Table 2.
Current usage metrics show cumulative count of Article Views (full-text article views including HTML views, PDF and ePub downloads, according to the available data) and Abstracts Views on Vision4Press platform.
Data correspond to usage on the plateform after 2015. The current usage metrics is available 48-96 hours after online publication and is updated daily on week days.
Initial download of the metrics may take a while.