Fig. 4
Download original image
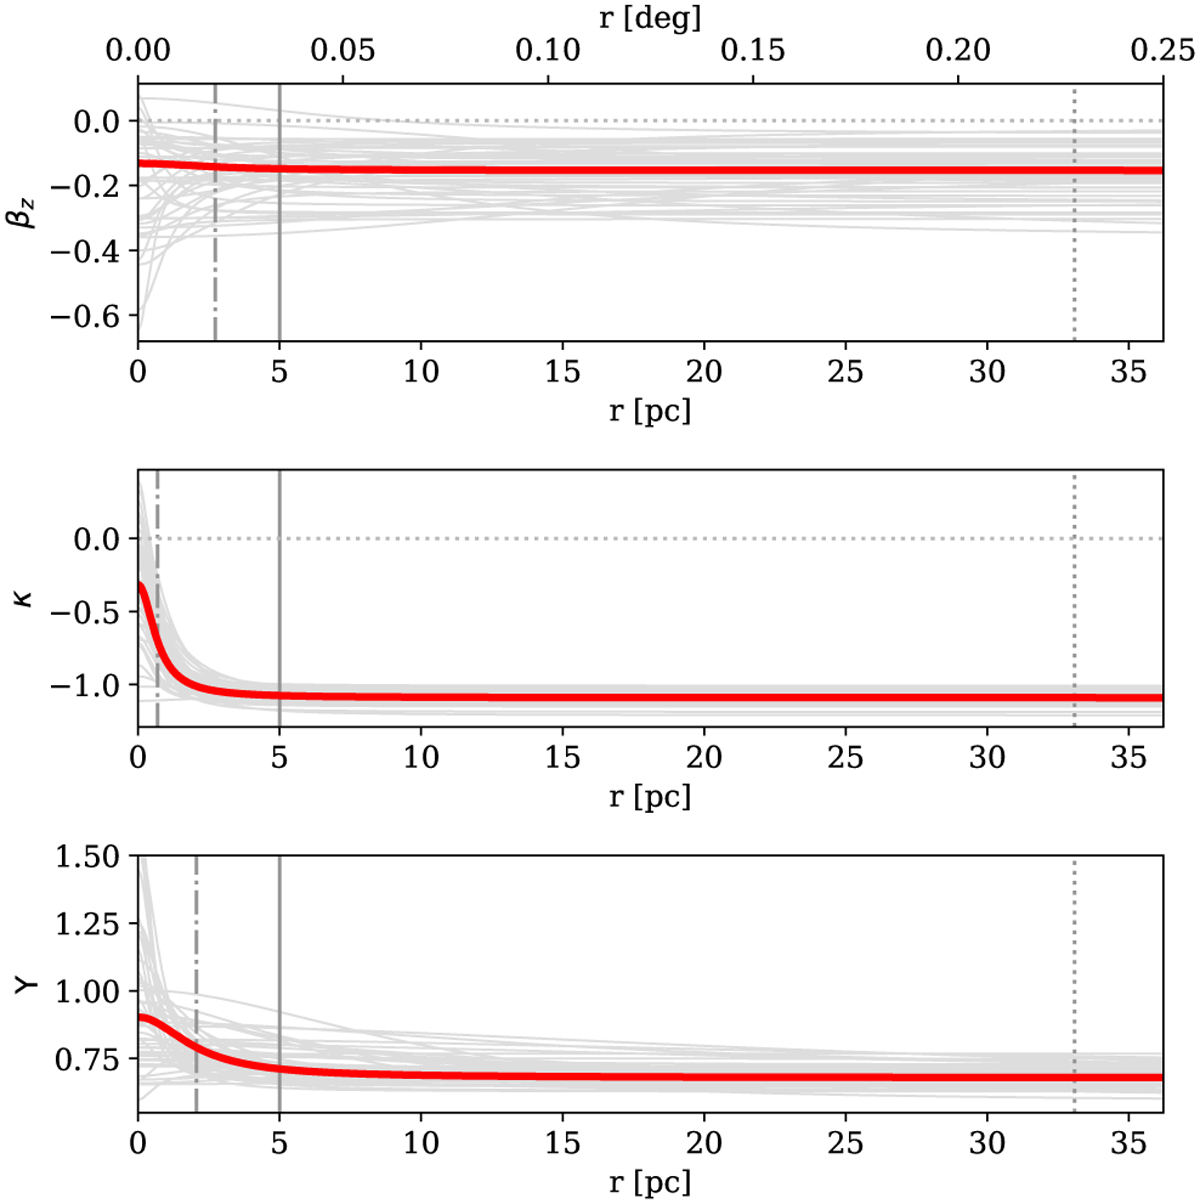
Radial profile of the velocity anisotropy βz (top), the rotation κ (middle), and the mass-to-number density conversion 𝚼 (bottom) as derived in Sect. 4.2 using a three-parameter function. The red lines denote the median of the posterior distribution, and the grey lines are 50 randomly drawn realisations from the posterior distribution. The vertical solid lines denote 1 Re = 5 pc, the dotted lines show the outer limit of the kinematic data, and the dot-dashed lines show the median of Rβ, Rκ, and R𝚼, respectively.
Current usage metrics show cumulative count of Article Views (full-text article views including HTML views, PDF and ePub downloads, according to the available data) and Abstracts Views on Vision4Press platform.
Data correspond to usage on the plateform after 2015. The current usage metrics is available 48-96 hours after online publication and is updated daily on week days.
Initial download of the metrics may take a while.