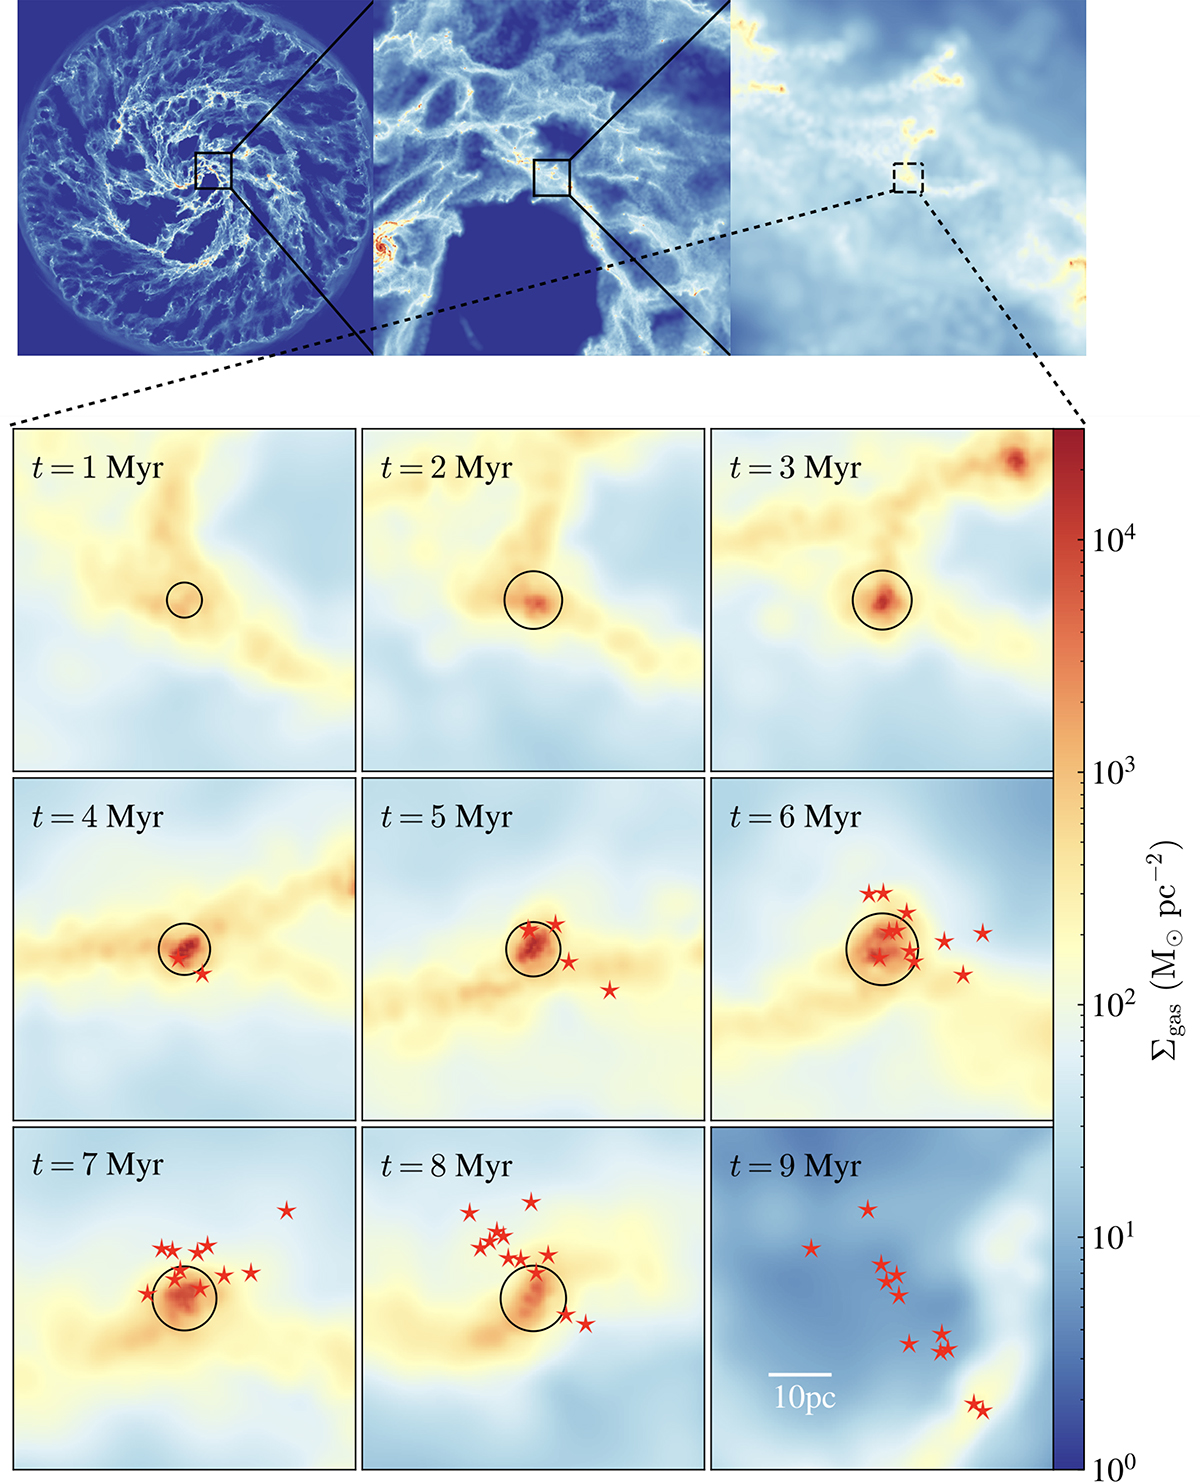
Fig. 1.
Download original image
Projections on the x−y plane (face-on) for the gas surface density across the life cycle of one example GMC. The upper panel with three sub-panels shows respectively physical scales of 50, 5, and 0.5 kpc on a side and illustrate the GMC’s position within the simulated disk galaxy at its birth. The bottom nine panels follow the evolution of this GMC at different ages as shown on the upper left of each panel. All star particles that form in this GMC are denoted with red stars. The black circle centered at the center-of-mass of the cloud on each panel indicates is the effective radius of the cloud at that time.
Current usage metrics show cumulative count of Article Views (full-text article views including HTML views, PDF and ePub downloads, according to the available data) and Abstracts Views on Vision4Press platform.
Data correspond to usage on the plateform after 2015. The current usage metrics is available 48-96 hours after online publication and is updated daily on week days.
Initial download of the metrics may take a while.