Fig. 2
Download original image
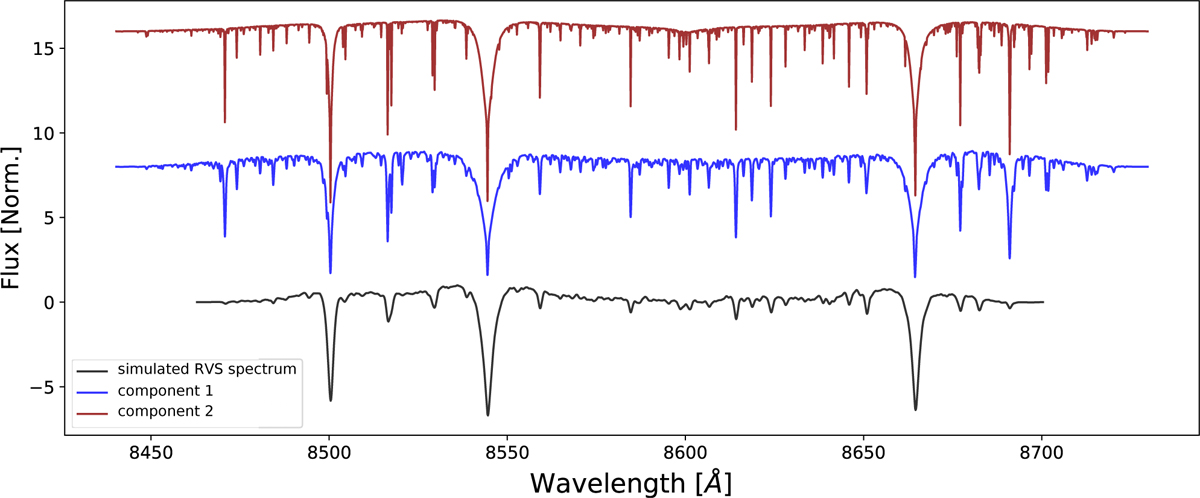
Underlying spectra of the two components from the simulated system presented in Fig. 1 at a random epoch (red and blue upper spectra), next to the resulting observed spectrum (lower spectrum in black). The spectral parameters for the two components are a Teff of 5500, and 6500 K, a log g of 6.0 and 5.0, Fe/H of 0.5 and 0 dex, and v sin i of 9 and 2 km s−1, respectively. The spectra are normalized to a continuum level of zero. To enhance clarity, the spectra are presented here in arbitrary units, and a vertical offset was applied to the plot to separate them visually.
Current usage metrics show cumulative count of Article Views (full-text article views including HTML views, PDF and ePub downloads, according to the available data) and Abstracts Views on Vision4Press platform.
Data correspond to usage on the plateform after 2015. The current usage metrics is available 48-96 hours after online publication and is updated daily on week days.
Initial download of the metrics may take a while.