Fig. 1
Download original image
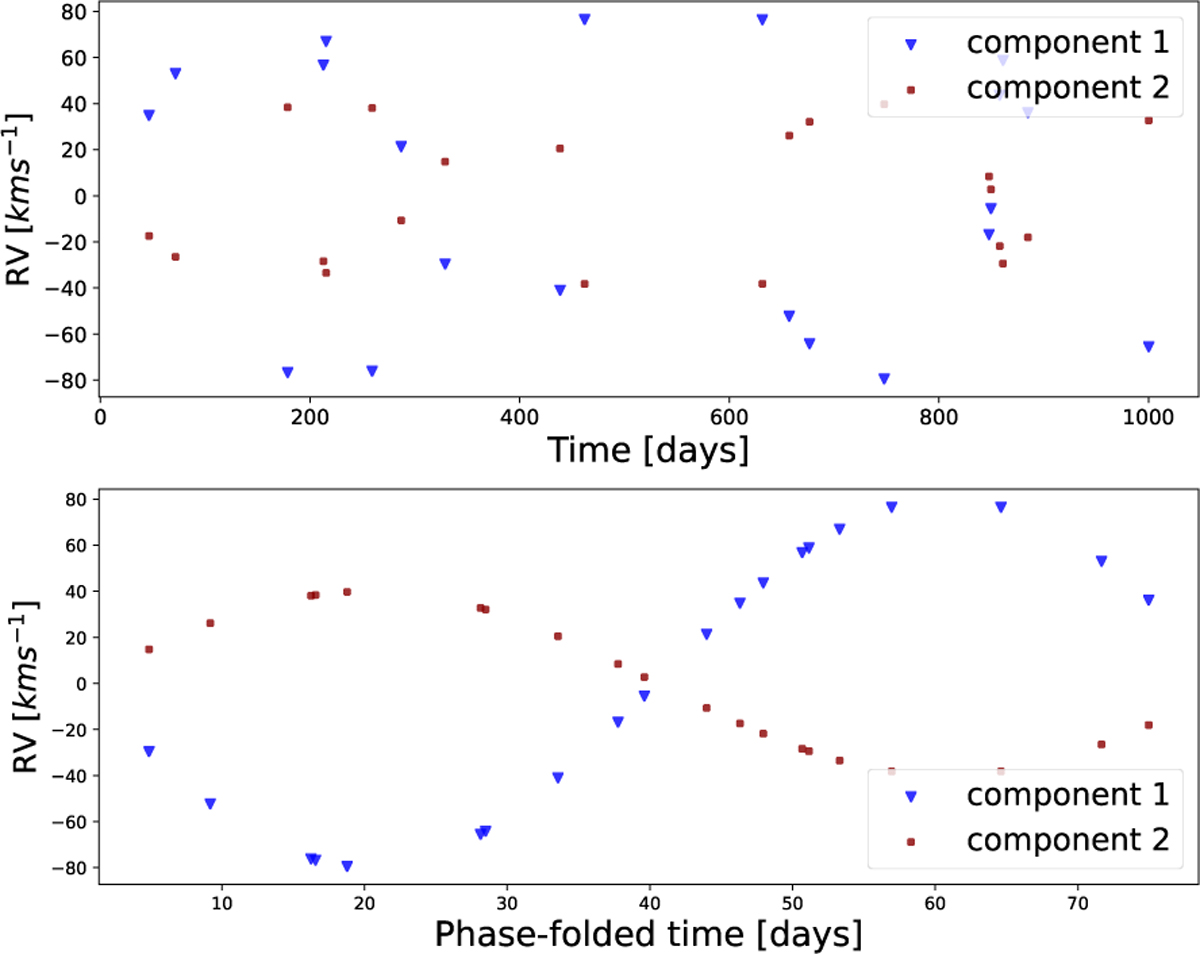
Example of a characteristic 20-epoch RV time series of an SB2 system generated in the process described in Sect. 2. The red circles mark the primary RV, and the blue triangles show the RV of the secondary. Top panel: RVs plotted against observation times. Bottom panel: same RV time-series, phase-folded by the known 81-day period.
Current usage metrics show cumulative count of Article Views (full-text article views including HTML views, PDF and ePub downloads, according to the available data) and Abstracts Views on Vision4Press platform.
Data correspond to usage on the plateform after 2015. The current usage metrics is available 48-96 hours after online publication and is updated daily on week days.
Initial download of the metrics may take a while.