Fig. 6.
Download original image
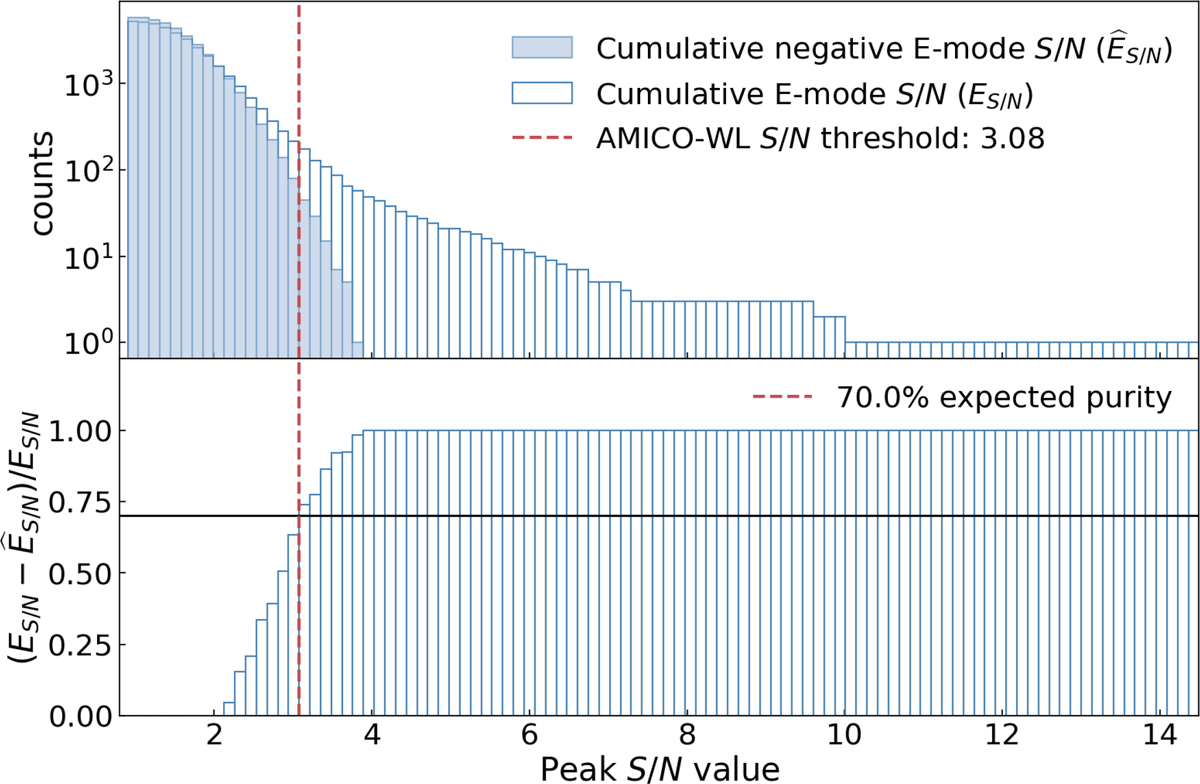
S/N threshold determination analysis. Top panel: Cumulative S/N distributions of positive (ES/N) and absolute negative peaks (![]() ) in the E-mode map detected with SExtractor. Bottom panel: Difference in cumulative counts of positive and negative peaks as a function of the S/N. The S/N threshold achieving a 70% purity is defined where the cumulative positive peak count reaches 70% of the total (horizontal line) and is marked across both panels (red vertical dashed line).
) in the E-mode map detected with SExtractor. Bottom panel: Difference in cumulative counts of positive and negative peaks as a function of the S/N. The S/N threshold achieving a 70% purity is defined where the cumulative positive peak count reaches 70% of the total (horizontal line) and is marked across both panels (red vertical dashed line).
Current usage metrics show cumulative count of Article Views (full-text article views including HTML views, PDF and ePub downloads, according to the available data) and Abstracts Views on Vision4Press platform.
Data correspond to usage on the plateform after 2015. The current usage metrics is available 48-96 hours after online publication and is updated daily on week days.
Initial download of the metrics may take a while.