Fig. 12.

Download original image
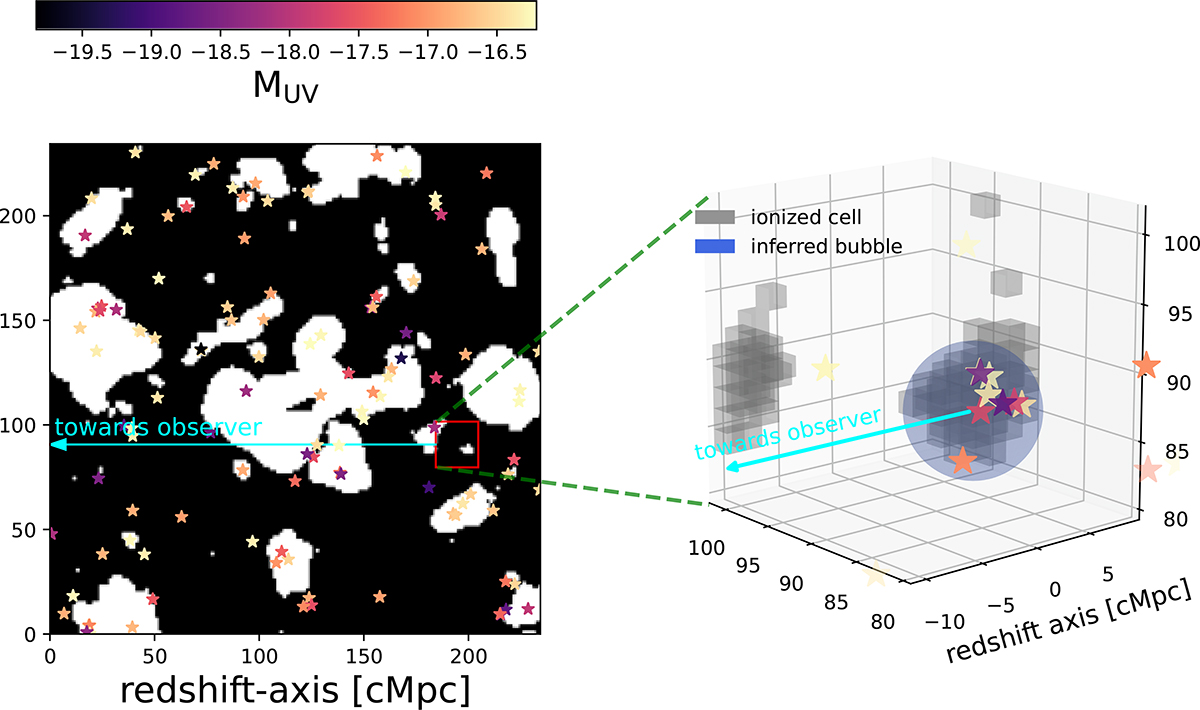
Application of our bubble-finding procedure to a 3D simulation. Left: 2D slices through the ionization field. Ionized/neutral regions are shown in white/black. The brightest galaxies in this 1.5 cMpc slice are denoted with stars, colored according to their UV magnitudes. The line-of-sight direction used to compute the IGM opacity for each observed galaxy is indicated with the arrow. The 20×20×20 cMpc subvolume used for the mock survey is denoted with the red square. Right: Zoom-in of the mock survey. A random subsample (to avoid overcrowding) of the observed galaxies is shown with stars. Ionized voxels are shown in gray. Our maximum likelihood solution for the central HII bubble is overlaid with the blue sphere. The reasonable overlap of the central gray blob with the blue sphere shows that our framework is reliable.
Current usage metrics show cumulative count of Article Views (full-text article views including HTML views, PDF and ePub downloads, according to the available data) and Abstracts Views on Vision4Press platform.
Data correspond to usage on the plateform after 2015. The current usage metrics is available 48-96 hours after online publication and is updated daily on week days.
Initial download of the metrics may take a while.


