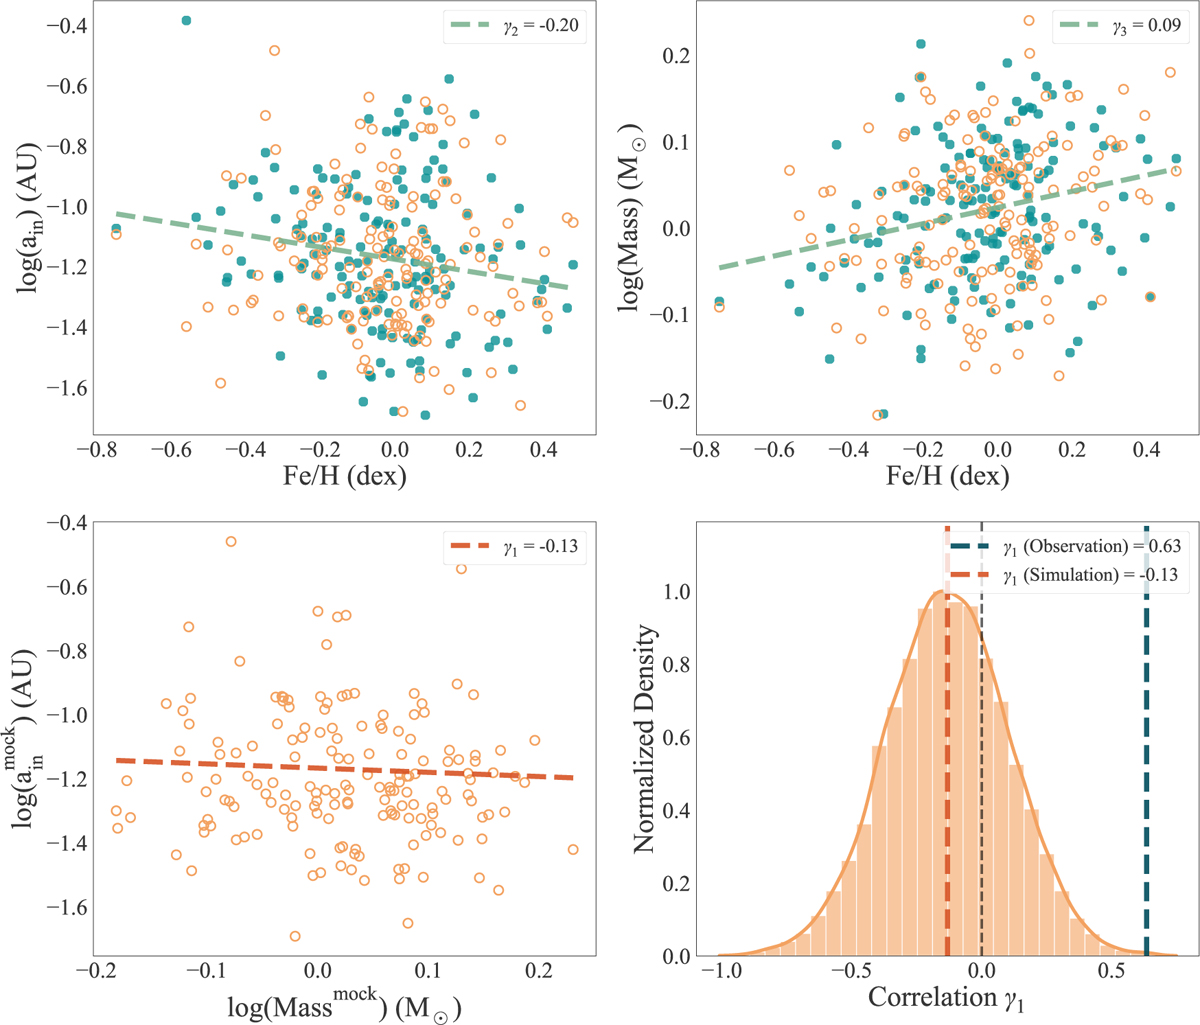
Fig. 4
Download original image
Effect of stellar metallicity on the stellar mass-inner edge correlation. The metallicity dependence of the inner edge and stellar mass, as well as their projection (top two panels) on the inner edge and stellar mass diagram (bottom-left panel). Green solid points represent all observational samples, while orange hollow points represent mock datasets generated from the simulation process. The light green dashed line represents the fitting results for the green solid points (γ2 and γ3 in Eqs. (5) and (6)), while the orange dashed line represents the fitting results for the orange hollow points (γ1 in Eq. (3)). The top two panels and the bottom-left panel collectively display the median result from the 10 000 simulation runs. The bottom-right panel shows the distribution of the correlation index (γ1) between the inner edge and stellar mass for the mock data (using Kernel Density Estimation), with the orange dashed line indicating the median of the distribution, the black dashed line indicating a correlation of zero, and the green dashed line representing the correlation of all observational data (as shown in the top-left panel of Fig. 3). Note: To further improve our analysis of stellar metallicity, we removed two outliers (with values less than -1.0) from the correlation analysis.
Current usage metrics show cumulative count of Article Views (full-text article views including HTML views, PDF and ePub downloads, according to the available data) and Abstracts Views on Vision4Press platform.
Data correspond to usage on the plateform after 2015. The current usage metrics is available 48-96 hours after online publication and is updated daily on week days.
Initial download of the metrics may take a while.