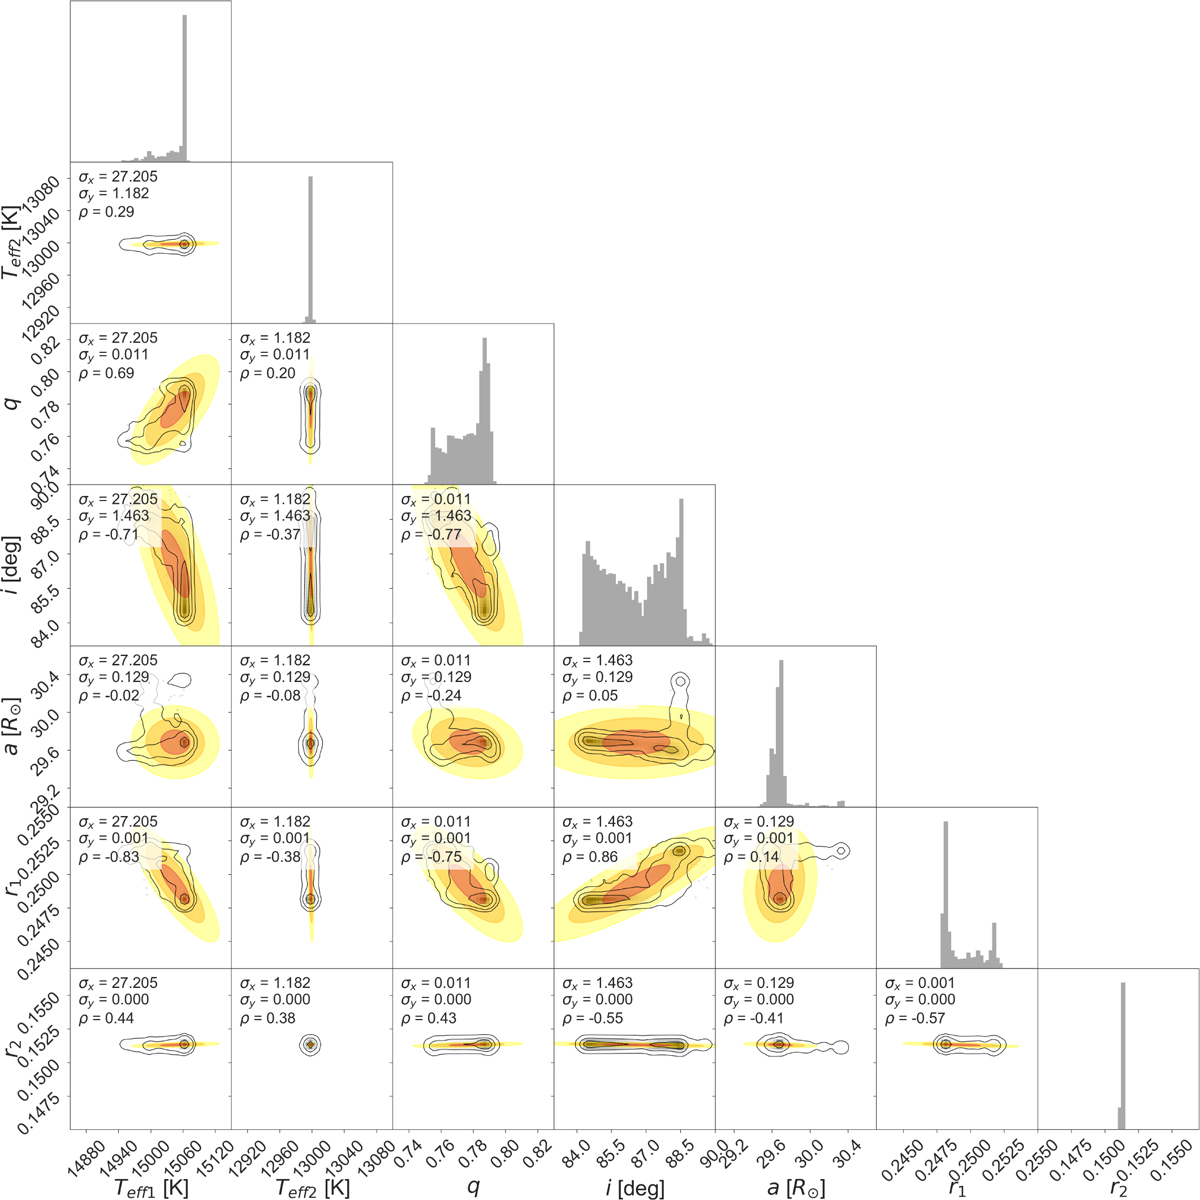
Fig. A.1
Download original image
Confidence ellipses on top of density levels for the last generations of a test dataset. Each subplot below the diagonal contains confidence ellipses corresponding to 1σ, 2σ, and 3σ confidence levels (red, orange, and yellow, respectively), derived from the covariance matrix of the parameters. Annotations in each subplot indicate the standard deviations along the axes (σx and σy) and the Pearson correlation coefficient (ρ).
Current usage metrics show cumulative count of Article Views (full-text article views including HTML views, PDF and ePub downloads, according to the available data) and Abstracts Views on Vision4Press platform.
Data correspond to usage on the plateform after 2015. The current usage metrics is available 48-96 hours after online publication and is updated daily on week days.
Initial download of the metrics may take a while.