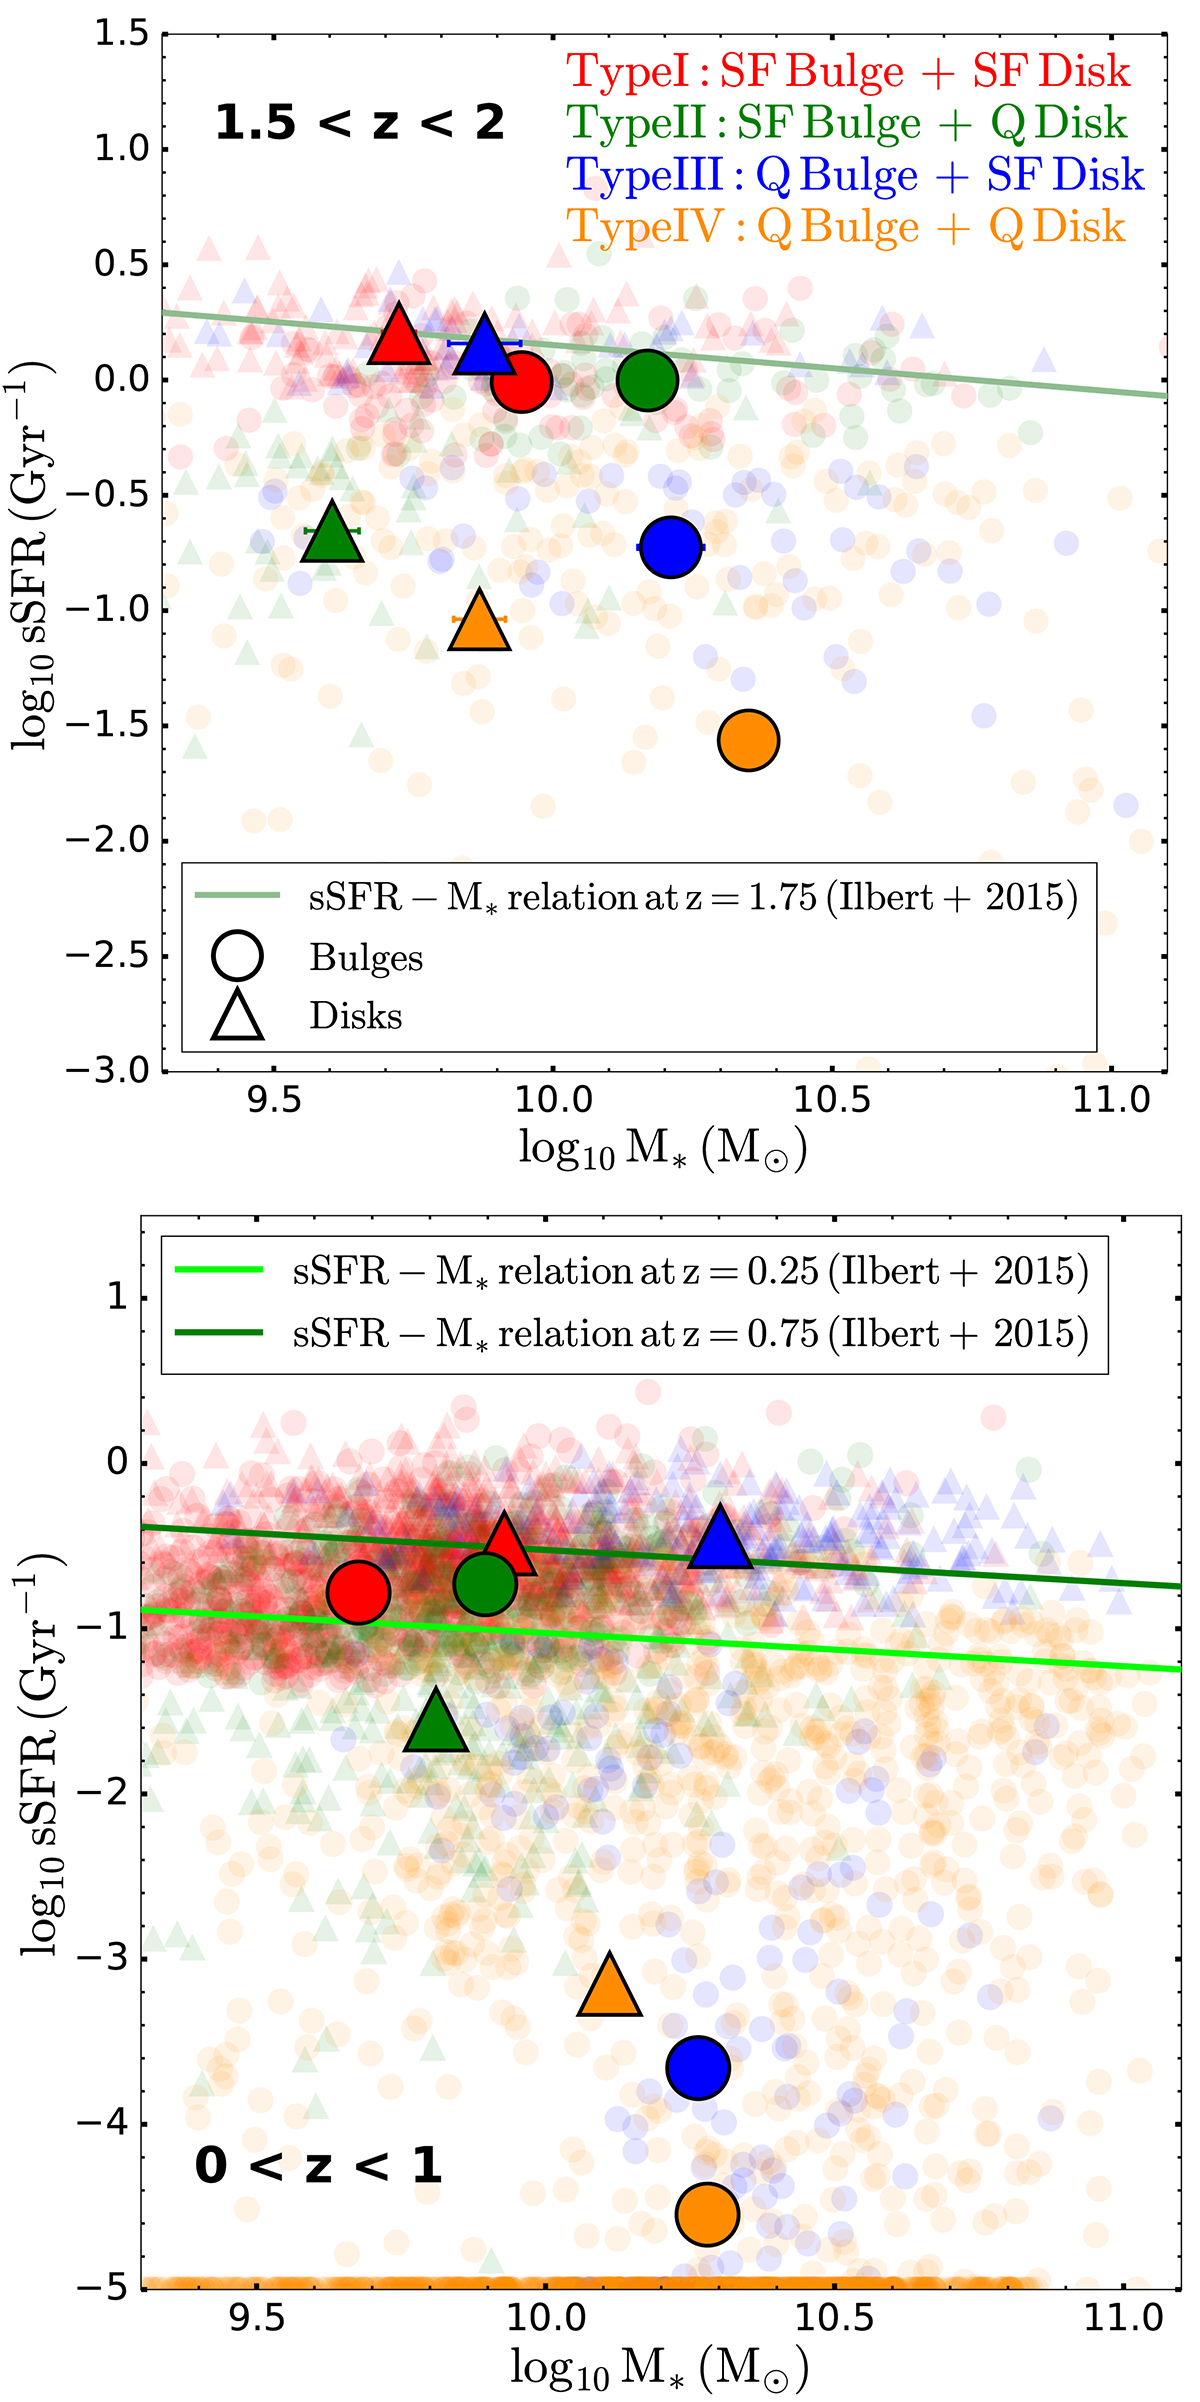
Fig. 9.
Download original image
Specific star-formation rate (sSFR)-stellar mass relation of the central regions and disk components of our selected sample of disk-like galaxies between 0<z<2, divided into the four galaxy types defined in Fig. 8 and in the two redshift intervals: 1.5<z<2 (i.e., high redshift) and 0<z<1 (i.e., low redshift). Small symbols represent the sSFR and stellar mass of the central regions and disk components of individual galaxies, while large symbols represent the mean values of the sSFR and stellar mass of the central regions and disk components for the galaxies belonging to each type. Error bars represent the standard error of the mean. The light-to-dark green solid lines represent the redshift-dependent parametrization of the star-forming main-sequence (SFMS) relation defined in Eq. (5) of Ilbert et al. (2015).
Current usage metrics show cumulative count of Article Views (full-text article views including HTML views, PDF and ePub downloads, according to the available data) and Abstracts Views on Vision4Press platform.
Data correspond to usage on the plateform after 2015. The current usage metrics is available 48-96 hours after online publication and is updated daily on week days.
Initial download of the metrics may take a while.