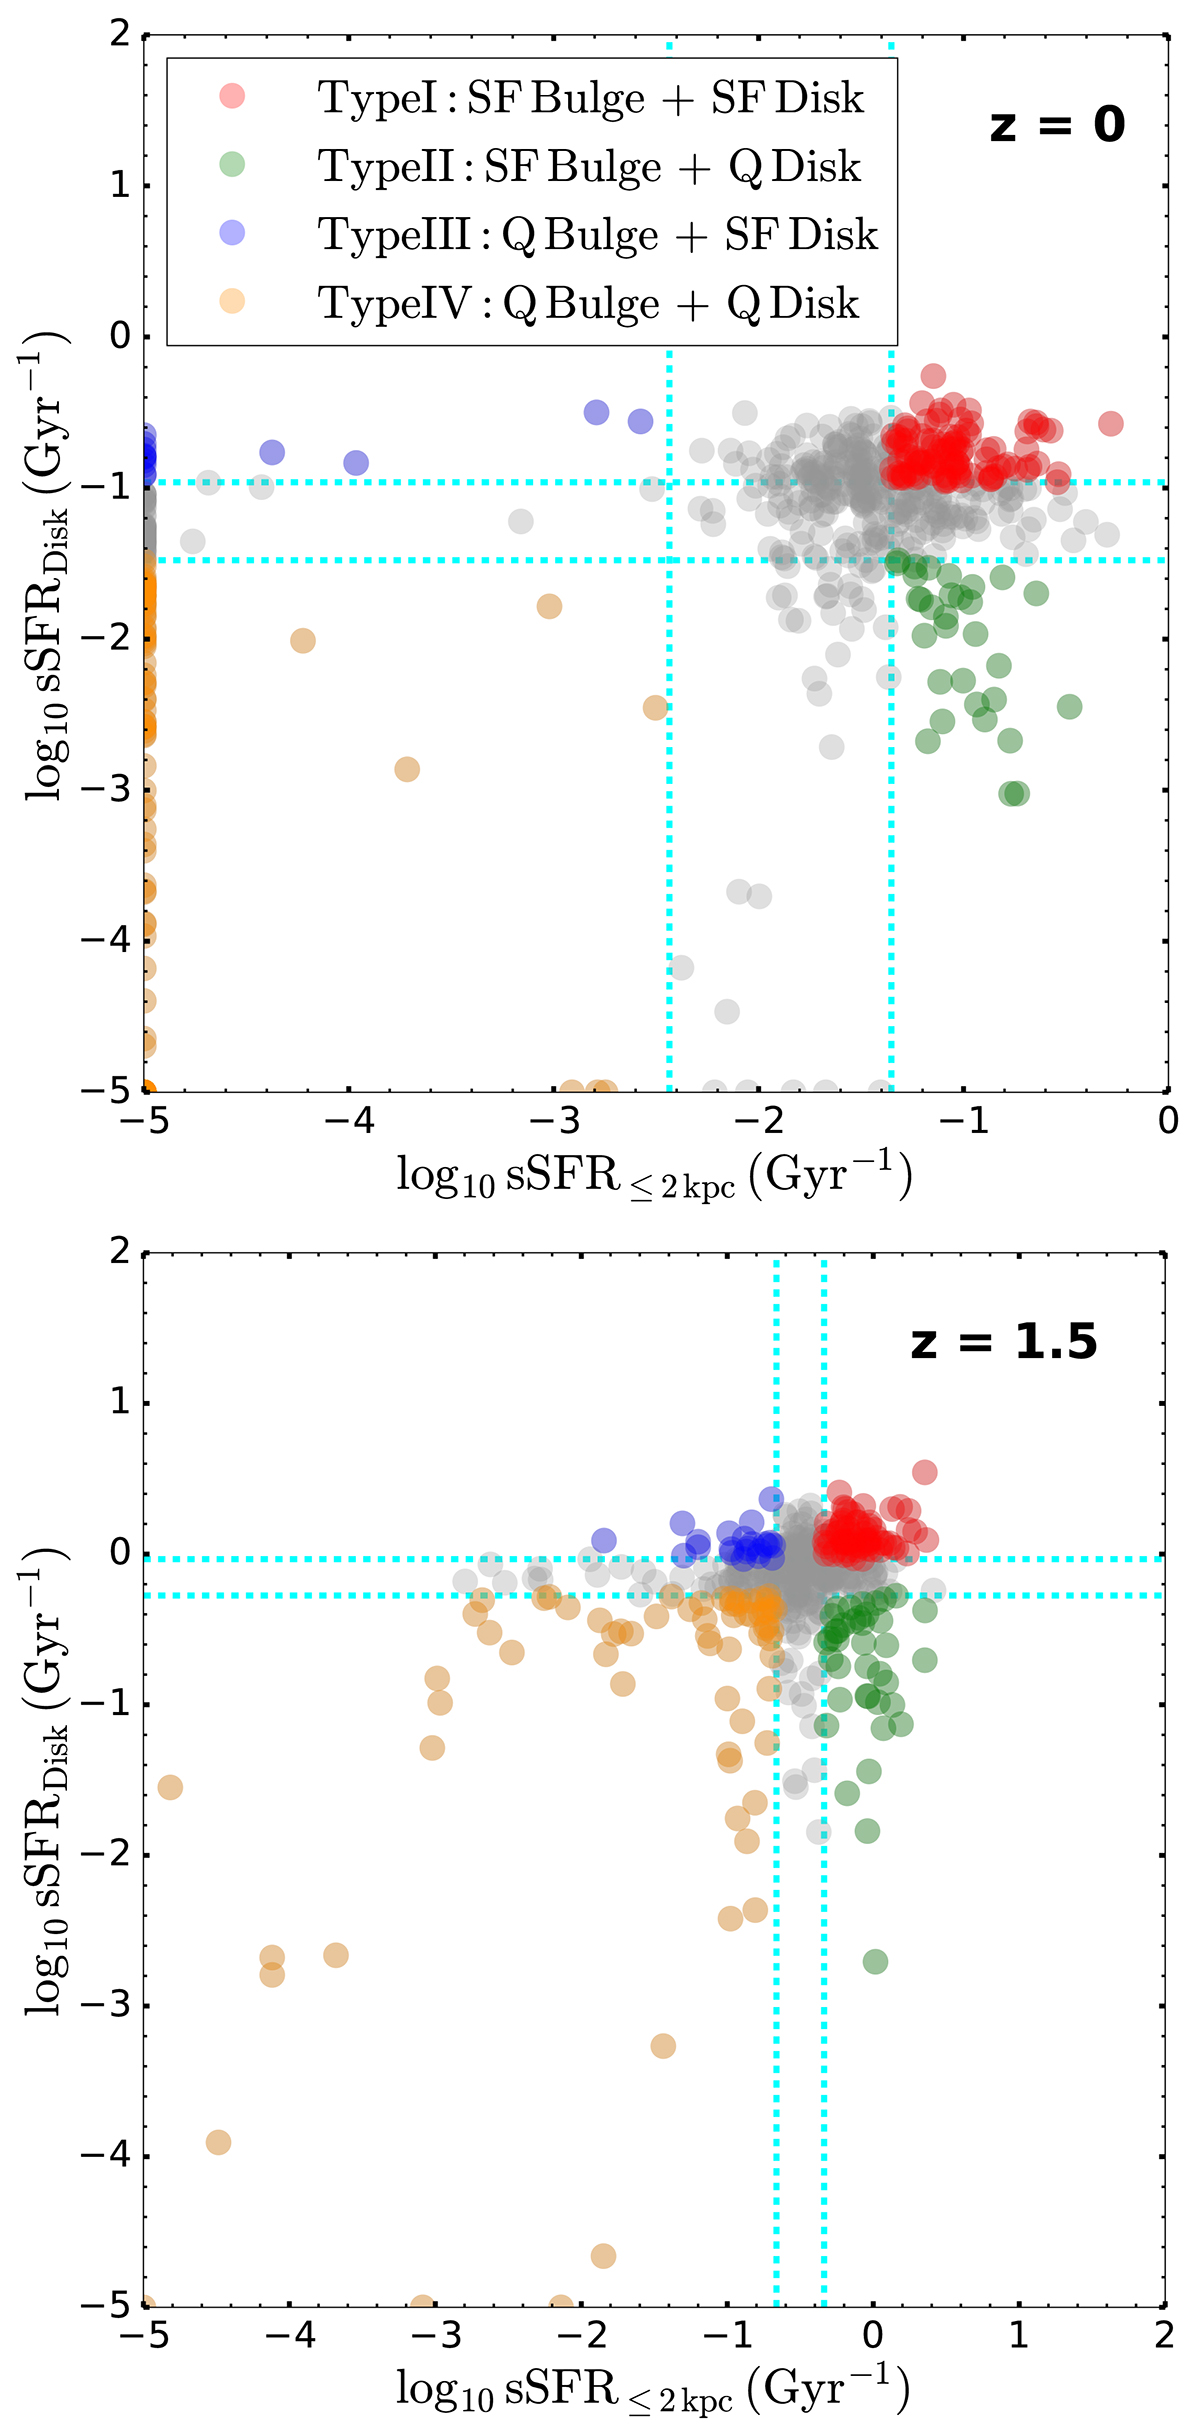
Fig. 8.
Download original image
Distribution of the specific star-formation rate (sSFR) of the central regions and disks of our selected sample of disk-like galaxies at z = 0 (top panel) and z = 1.5 (bottom panel). The sSFR of the different components of the galaxies are calculated as described in Sect. 5.1. We divide the sSFR of the central regions and disks in tertiles (dashed lines) and we select the four galaxy sub-samples lying on the outside of the tertile contours (coloured points). These four galaxy sub-samples represent the sub-samples of star-forming cores (disks) and quenched cores (disks) defined in Sect. 5.1, similarly to Le Bail et al. (2024).
Current usage metrics show cumulative count of Article Views (full-text article views including HTML views, PDF and ePub downloads, according to the available data) and Abstracts Views on Vision4Press platform.
Data correspond to usage on the plateform after 2015. The current usage metrics is available 48-96 hours after online publication and is updated daily on week days.
Initial download of the metrics may take a while.