Fig. 3.
Download original image
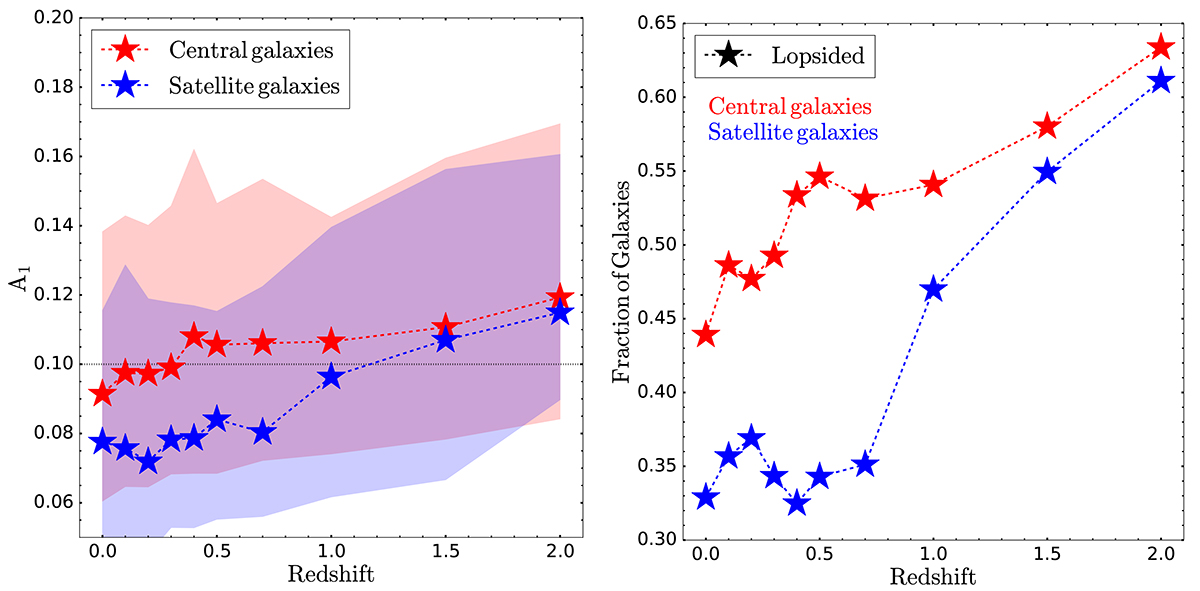
Left panel: Median lopsided amplitude as a function of redshift for our selected sample of disk-like galaxies at each analyzed redshift between 0<z<2, divided into centrals and satellites. Shaded areas are defined by the 25th–75th interquartile range of the data at each bin. The horizontal dotted black line indicates the threshold A1 = 0.1 used to classify galaxies into lopsided (A1>0.1) and symmetric (A1<0.1) at z = 0 (Varela-Lavin et al. 2023; Dolfi et al. 2023). Right panel: Fraction of lopsided galaxies as a function of redshift for centrals and satellites.
Current usage metrics show cumulative count of Article Views (full-text article views including HTML views, PDF and ePub downloads, according to the available data) and Abstracts Views on Vision4Press platform.
Data correspond to usage on the plateform after 2015. The current usage metrics is available 48-96 hours after online publication and is updated daily on week days.
Initial download of the metrics may take a while.