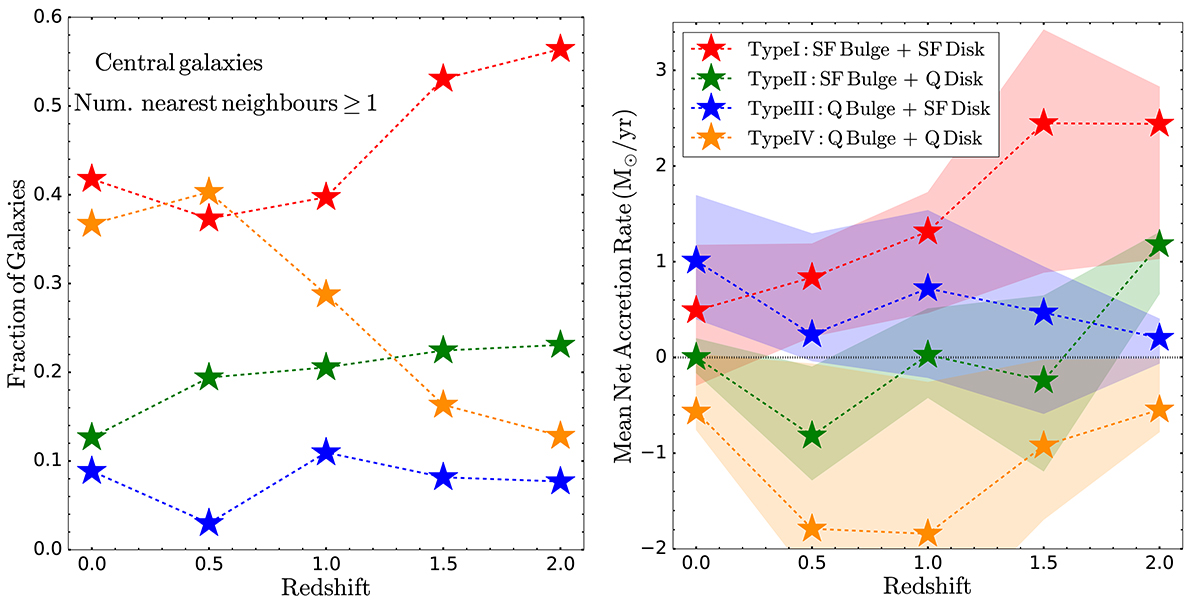
Fig. 11.
Download original image
Left panel: Number of galaxies of a given type and with one or more massive neighbors (stellar mass-ratio >1:10) within 0.5×R200 during the last 3 Gyr of the galaxy history, normalized by the total number of galaxies of all types and with one or more massive neighbors at the five different specific redshift z = 2, 1.5, 1, 0.5 and 0. We only consider here the central galaxies in our sample. Right panel: Mean net accretion rate within the last 1 Gyr onto the galactic disk of our selected sample of galaxies at the five different specific redshift z = 2, 1.5, 1, 0.5, 0. Here, we consider all the central galaxies in our sample (i.e., with number of nearest neighbors ≥0). Shaded areas are defined by the 25th–75th interquartile range of the data at each redshift. We divide our galaxies into the four different types, as described in Sect. 5.1.
Current usage metrics show cumulative count of Article Views (full-text article views including HTML views, PDF and ePub downloads, according to the available data) and Abstracts Views on Vision4Press platform.
Data correspond to usage on the plateform after 2015. The current usage metrics is available 48-96 hours after online publication and is updated daily on week days.
Initial download of the metrics may take a while.