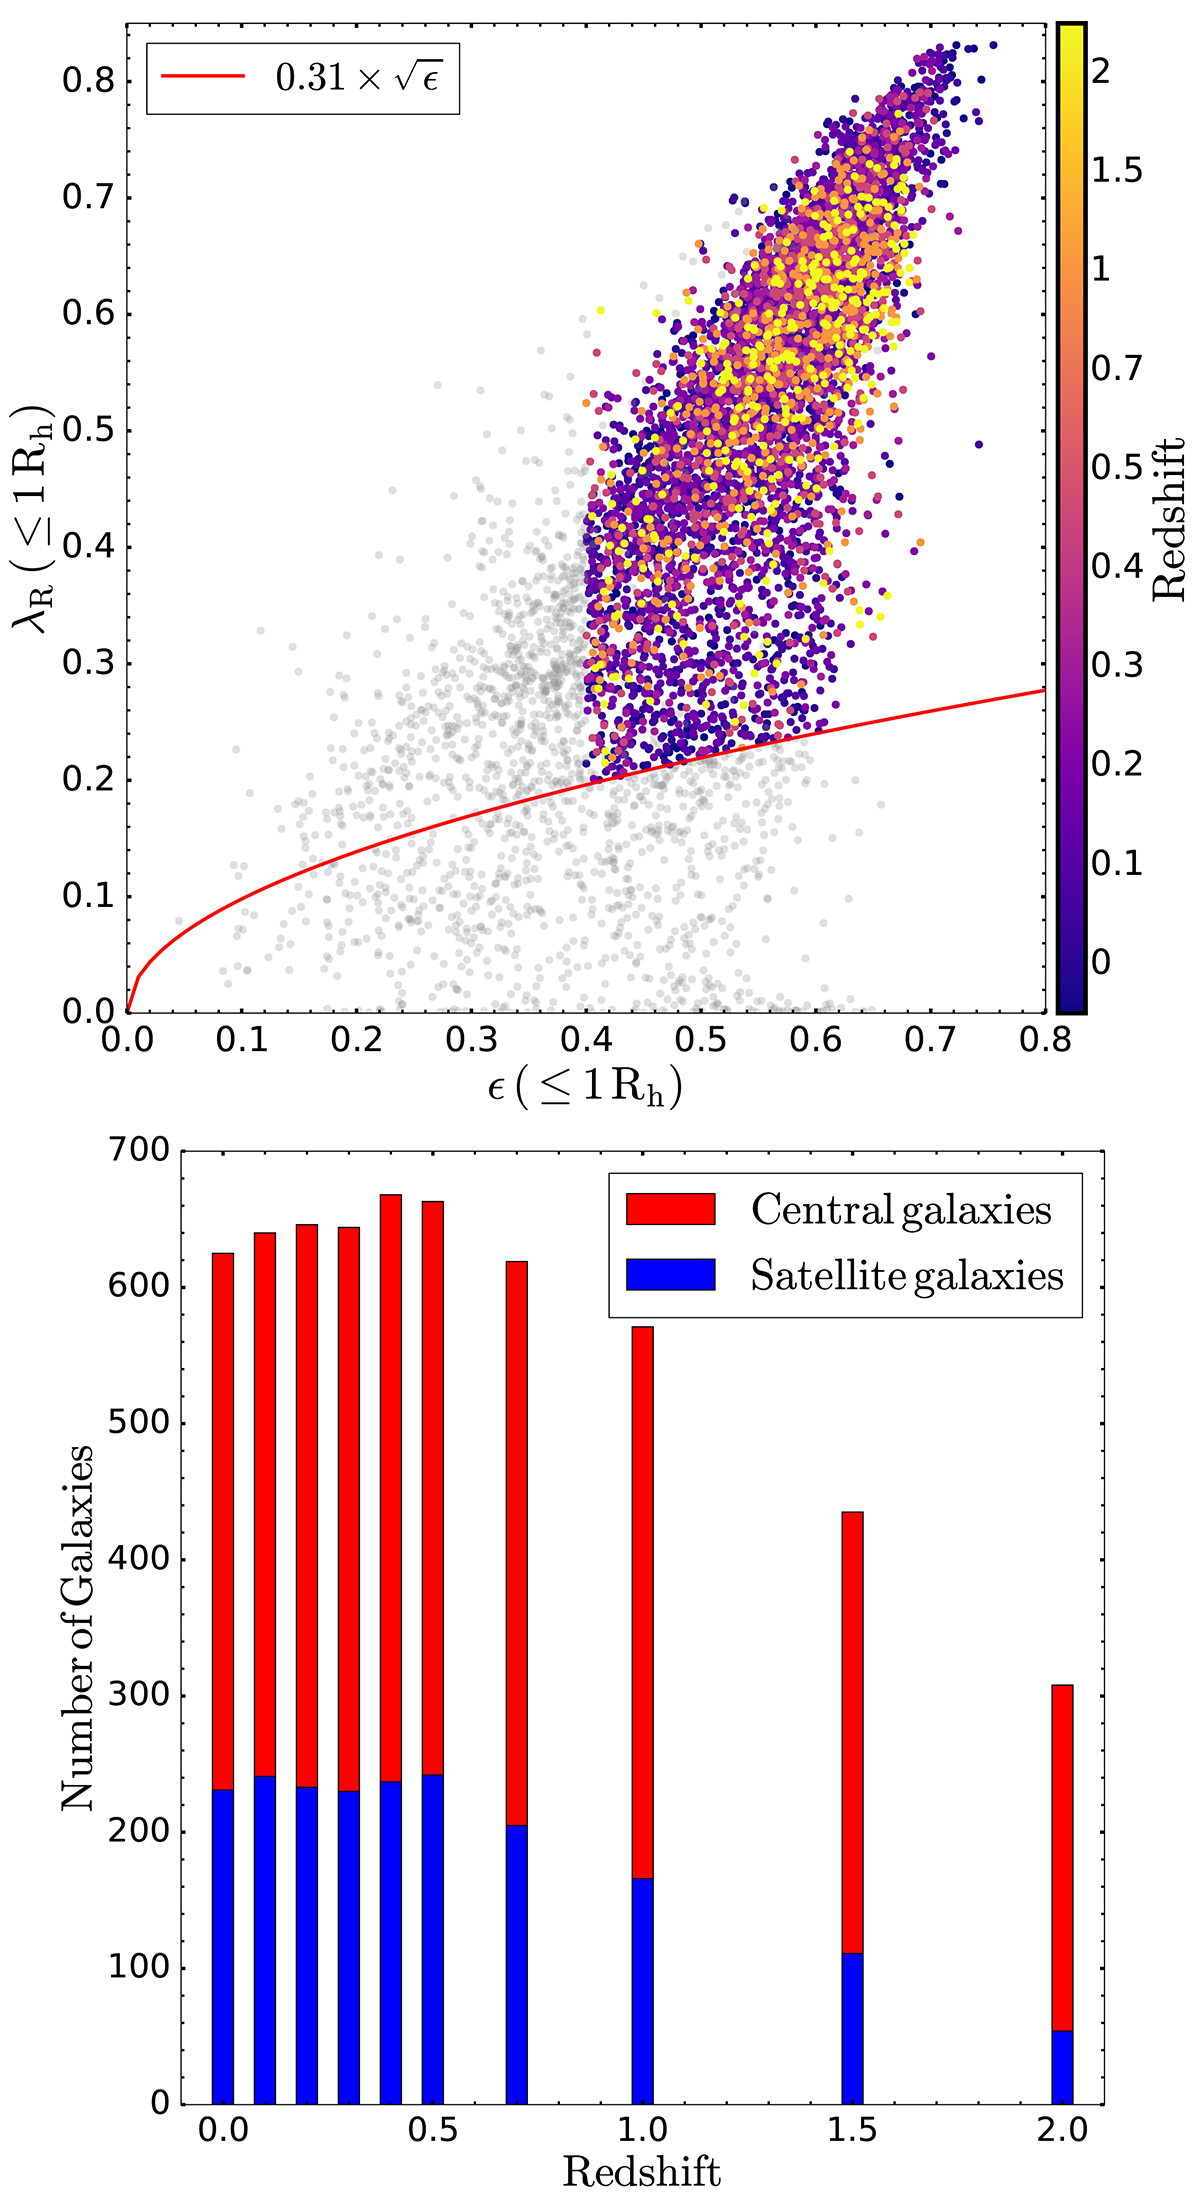
Fig. 1.
Download original image
Top panel: Spin-ellipticity (i.e., λR−ϵ) diagram of the galaxies selected from the TNG50 simulation between 0<z<2 (gray points). The colored points show our final sample of disk-like galaxies, using the selection criteria described in Sect. 2.5. The red solid line represents the threshold typically used in observations to separate between rotation-dominated and dispersion-supported galaxies within the inner stellar half-light radius at z = 0 (Emsellem et al. 2011). Bottom panel: Total number of central and satellite galaxies of our final sample of disk-like galaxies at each redshift, selected as described in Sect. 2.5.
Current usage metrics show cumulative count of Article Views (full-text article views including HTML views, PDF and ePub downloads, according to the available data) and Abstracts Views on Vision4Press platform.
Data correspond to usage on the plateform after 2015. The current usage metrics is available 48-96 hours after online publication and is updated daily on week days.
Initial download of the metrics may take a while.