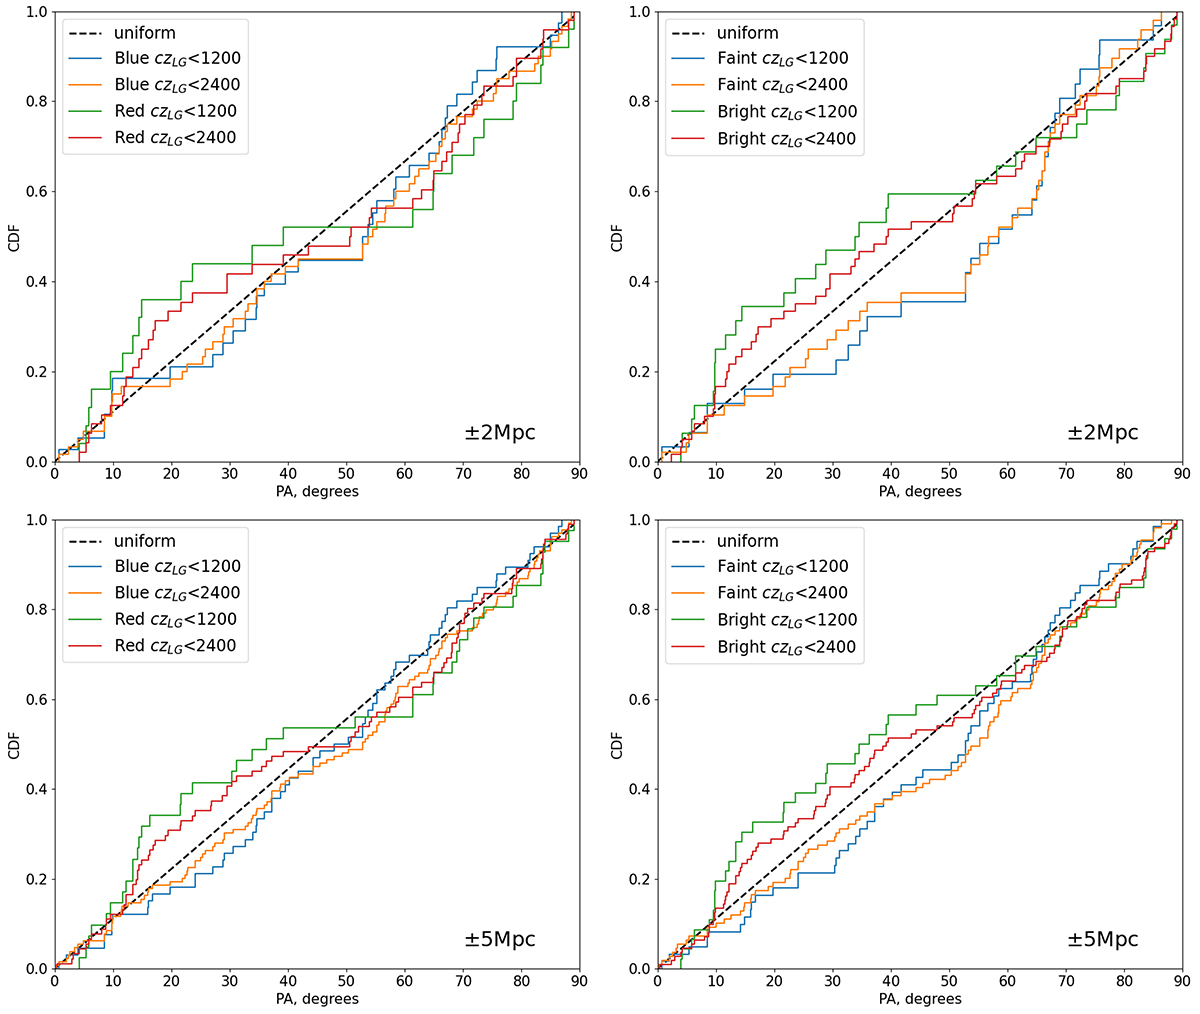
Fig. 3.
Download original image
Cumulative PA distributions of edge-on galaxies with respect to the supergalactic plane. The panels show the distributions within the czLG < 1200 and czLG < 2400 km s−1 ranges for subsamples of the bright and faint galaxies, separated by stellar mass at M* = 108.7 M⊙, as well as for the blue and red galaxies, divided by color at (g − i)0 = 0.86 mag. The top row corresponds to the ±2 Mpc layer relative to the supergalactic plane, and the bottom row shows the distributions within the ±5 Mpc layer. The virial zone of the Virgo cluster was excluded from our consideration. The dashed black line indicates the uniform distribution.
Current usage metrics show cumulative count of Article Views (full-text article views including HTML views, PDF and ePub downloads, according to the available data) and Abstracts Views on Vision4Press platform.
Data correspond to usage on the plateform after 2015. The current usage metrics is available 48-96 hours after online publication and is updated daily on week days.
Initial download of the metrics may take a while.