Fig. 1.
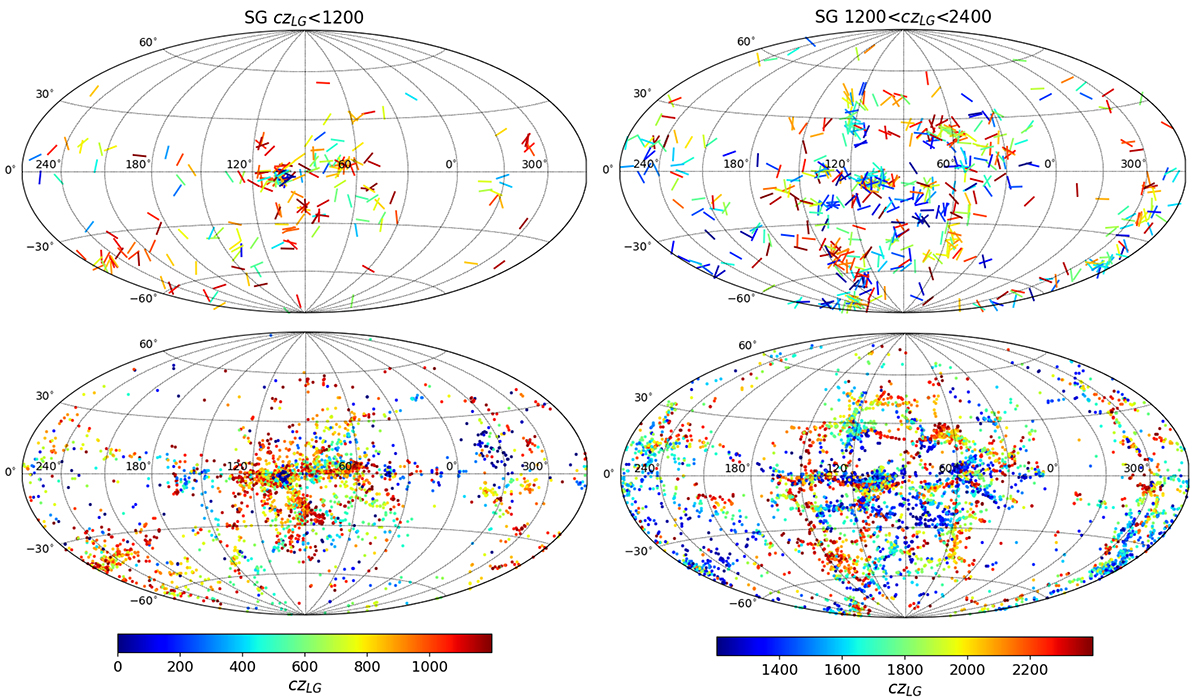
Download original image
All-sky maps of the galaxy distribution in supergalactic coordinates (Aitoff projection). Top row: Edge-on galaxies in our sample, split into two redshift intervals: czLG < 1200 km s−1 (left) and 1200 < czLG < 2400 km s−1 (right). The major axes are shown as short segments. Bottom row: Nearby galaxies from the 50 Mpc Galaxy Catalog (Ohlson et al. 2024) in the same redshift intervals as above. The colors indicate the redshifts in the Local Group centroid reference frame.
Current usage metrics show cumulative count of Article Views (full-text article views including HTML views, PDF and ePub downloads, according to the available data) and Abstracts Views on Vision4Press platform.
Data correspond to usage on the plateform after 2015. The current usage metrics is available 48-96 hours after online publication and is updated daily on week days.
Initial download of the metrics may take a while.