Open Access
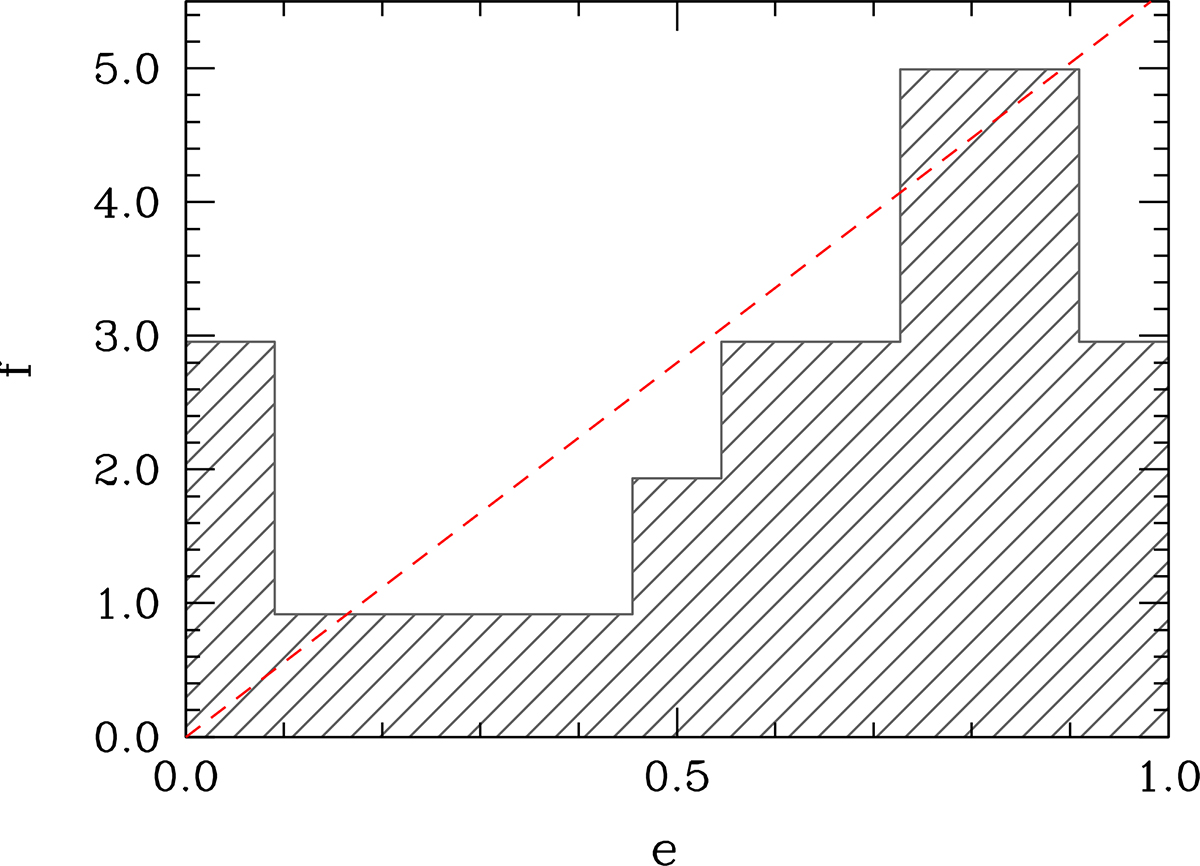
Fig. 6.
Download original image
Initial eccentricity distribution for the systems analyzed in this work. Despite the scarcity of the data, the distribution seems to be consistent with the canonical thermal distribution (red line), f = 2e, although some initially already circularized systems appear in the sample.
Current usage metrics show cumulative count of Article Views (full-text article views including HTML views, PDF and ePub downloads, according to the available data) and Abstracts Views on Vision4Press platform.
Data correspond to usage on the plateform after 2015. The current usage metrics is available 48-96 hours after online publication and is updated daily on week days.
Initial download of the metrics may take a while.