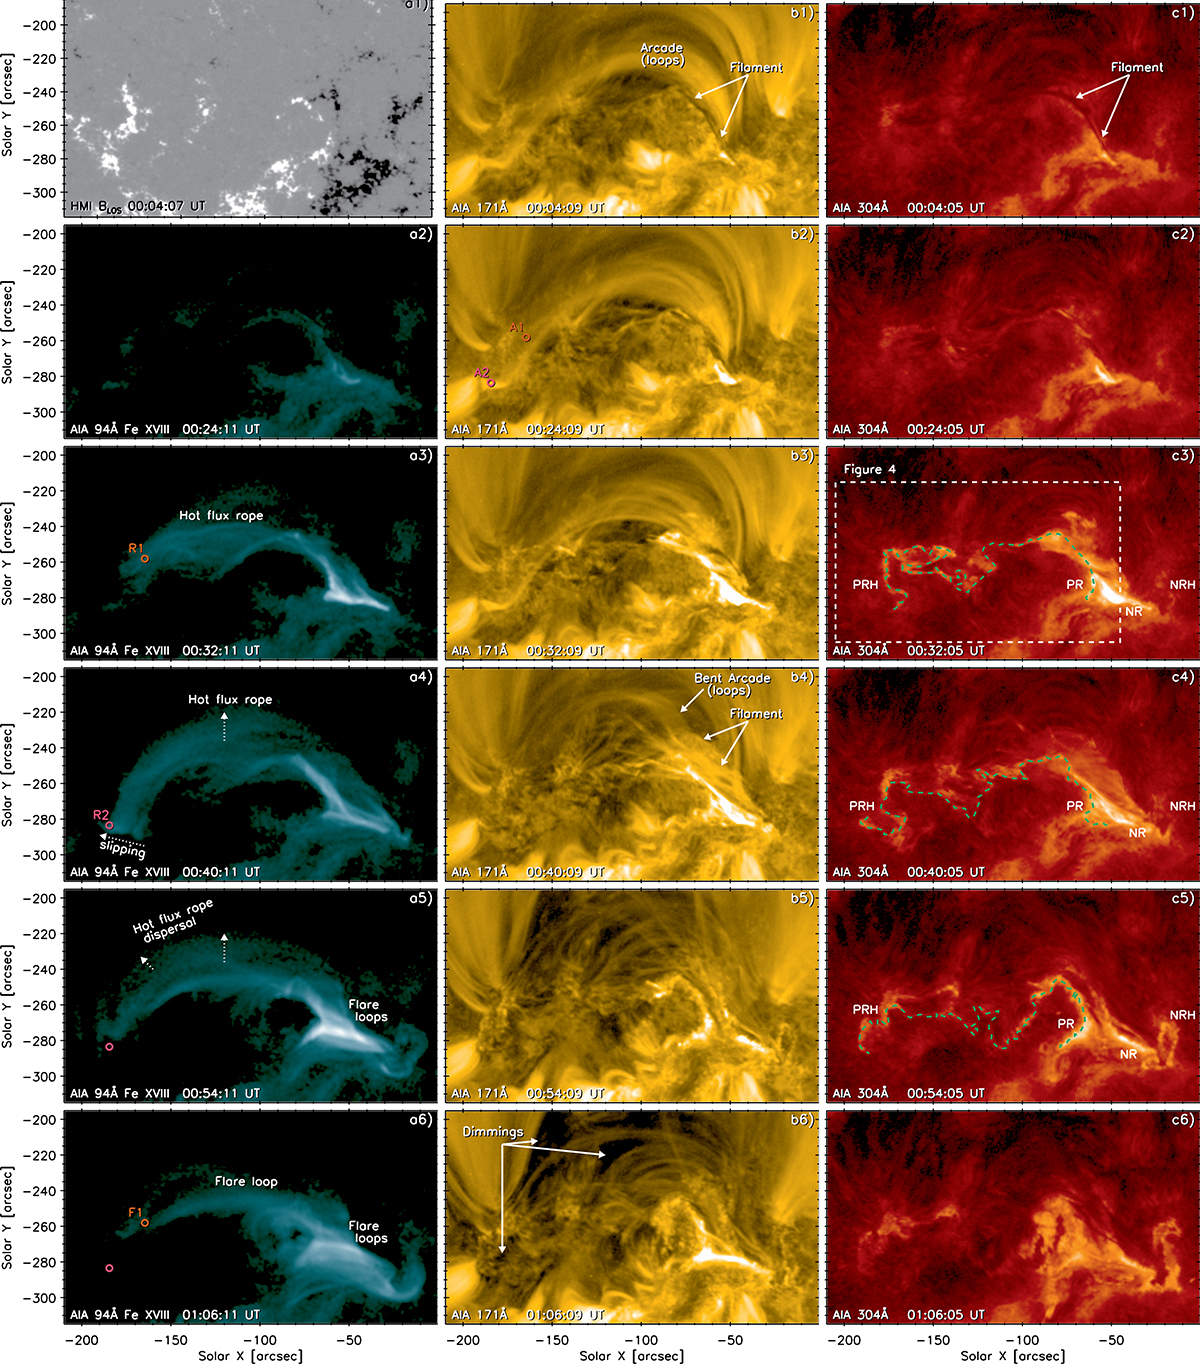
Fig. 3.
Download original image
Overview of the B-class flares and eruption of December 9, 2020, as observed by SDO in three AIA filters at 94 Å, 171 Å, and 304 Å. Note that the Fe XVIII contribution has been separated from the 94 Å filtergrams (see Appendix B). The HMI magnetogram of a portion of the decaying AR is shown in panel (a), and is saturated to ±300 G. One example of an interaction between the filament with a bent arcade (loops) is shown in panels (a4)–(b4) with the evolution of the hot flux indicated by white arrows in panel (a4). An online animation is attached to this figure (Movie_overview_aia.mpg).
Current usage metrics show cumulative count of Article Views (full-text article views including HTML views, PDF and ePub downloads, according to the available data) and Abstracts Views on Vision4Press platform.
Data correspond to usage on the plateform after 2015. The current usage metrics is available 48-96 hours after online publication and is updated daily on week days.
Initial download of the metrics may take a while.