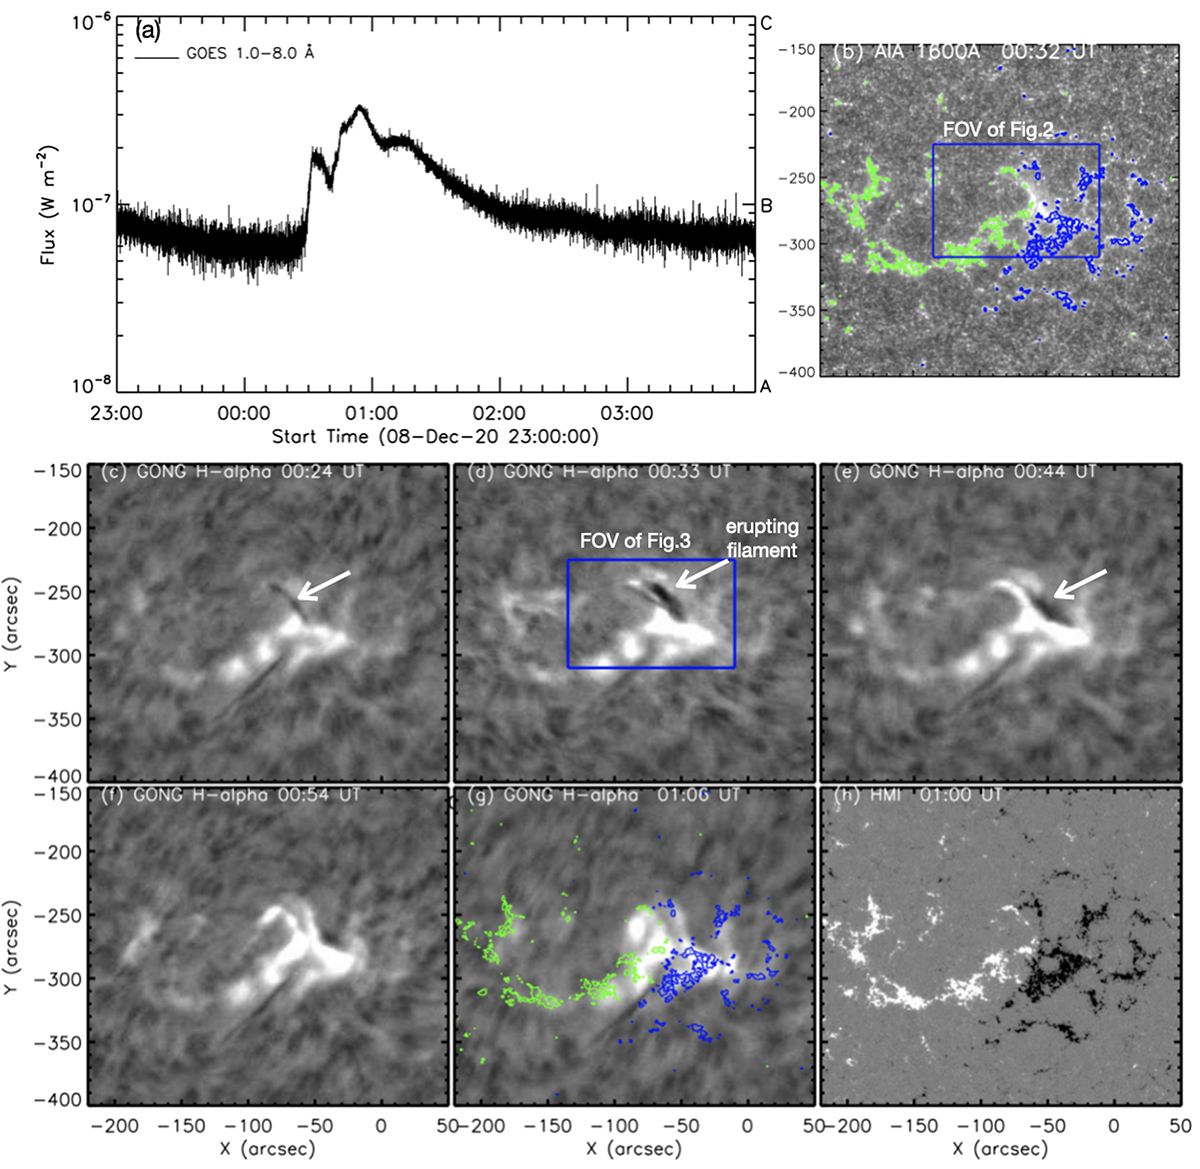
Fig. 1.
Download original image
GOES B3.2 class flare that peaked at 00:53 UT, and that has a small flare peak at 00:33 as a B1.7 class on December 9, 2020 (panel a). Panel b shows the flare ribbons in the UV temperature overplotted with a magnetic field of strength of ±200 G (green for positive and blue for negative polarity) from the HMI magnetogram. Panels c–g show the evolution of the flare region in the Hα wavelength, where the filament is shown with white arrows. Panel (h) shows the magnetic field configuration at the flare site and neighborhood.
Current usage metrics show cumulative count of Article Views (full-text article views including HTML views, PDF and ePub downloads, according to the available data) and Abstracts Views on Vision4Press platform.
Data correspond to usage on the plateform after 2015. The current usage metrics is available 48-96 hours after online publication and is updated daily on week days.
Initial download of the metrics may take a while.