Fig. 6
Download original image
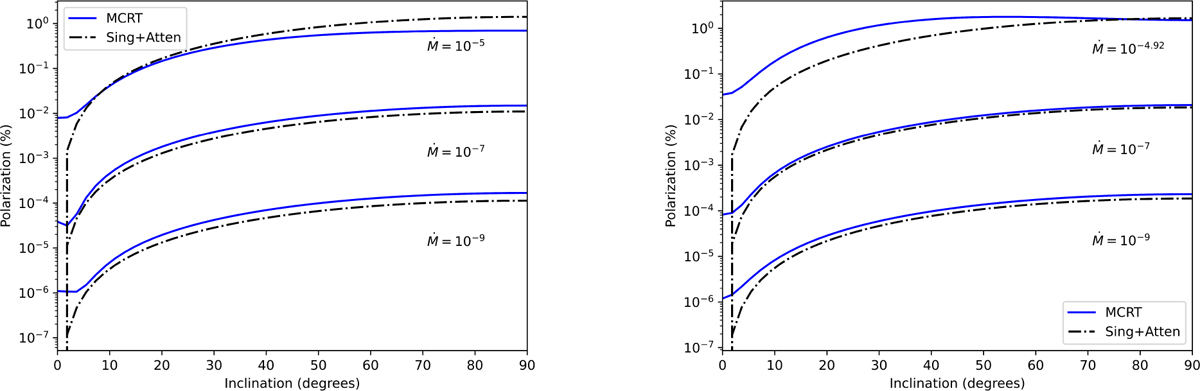
Comparison of polarization from the multiple-scattering model (MCRT simulation, full blue lines) and single-scattering (Sing+Atten) model with attenuation (dash-dotted black lines) as a function of inclination for WR93 (left panel) and WR102 (right panel). The blue and black lines are labeled with the mass-loss rates in units of ![]() .
.
Current usage metrics show cumulative count of Article Views (full-text article views including HTML views, PDF and ePub downloads, according to the available data) and Abstracts Views on Vision4Press platform.
Data correspond to usage on the plateform after 2015. The current usage metrics is available 48-96 hours after online publication and is updated daily on week days.
Initial download of the metrics may take a while.