Fig. 9
Download original image
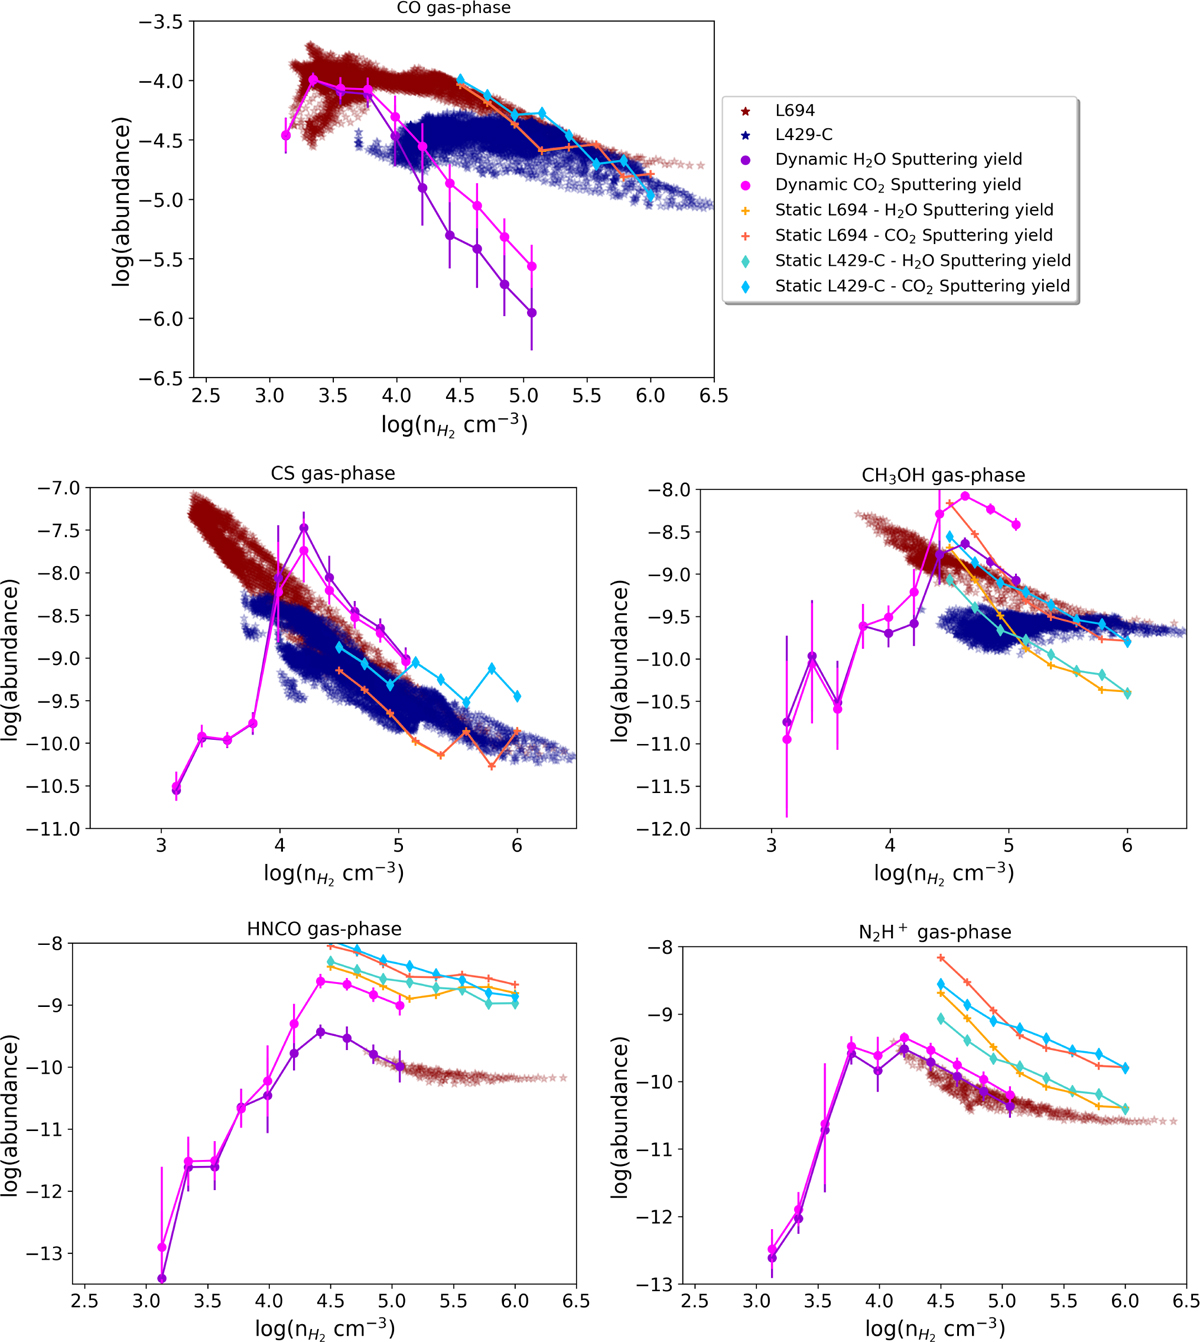
Mean abundances computed with the dynamical model (filled circles) as a function of density (see text). Standard deviation for the cold core is shown with vertical bars. Red and blue stars mark the observed abundances in L694 (this study) and L429-C (Taillard et al. 2023), respectively. Crosses and diamonds denote the abundances obtained at the best times with the static models, which only probe the density where the three molecules (CO, CS, and CH3OH) used to determine the ‘best time’ are detected. Results obtained from using both cosmic-ray sputtering yields are shown for all the models.
Current usage metrics show cumulative count of Article Views (full-text article views including HTML views, PDF and ePub downloads, according to the available data) and Abstracts Views on Vision4Press platform.
Data correspond to usage on the plateform after 2015. The current usage metrics is available 48-96 hours after online publication and is updated daily on week days.
Initial download of the metrics may take a while.