Open Access
Fig. 3
Download original image
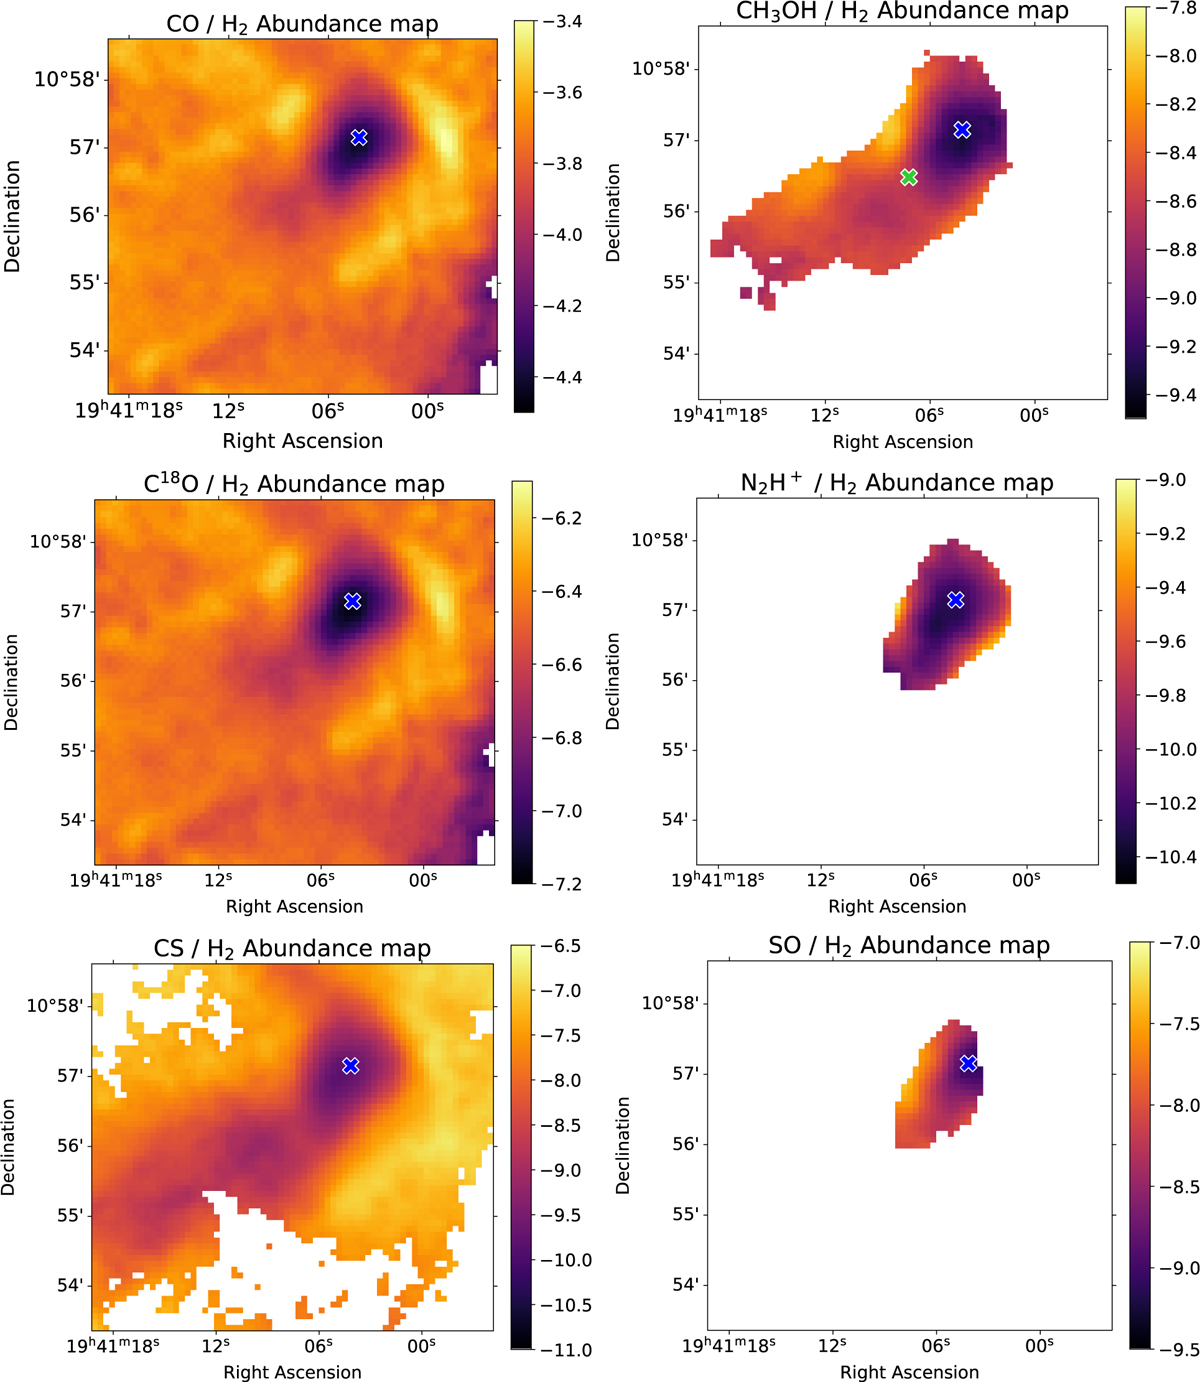
Gas-phase abundances of observed molecules with respect to H2 on a logarithm scale (log(Xmol)). The green cross marked on the CH3OH map indicates the position of the background star towards which methanol ice was observed by Chu et al. (2020). The blue star represents the continuum peak position.
Current usage metrics show cumulative count of Article Views (full-text article views including HTML views, PDF and ePub downloads, according to the available data) and Abstracts Views on Vision4Press platform.
Data correspond to usage on the plateform after 2015. The current usage metrics is available 48-96 hours after online publication and is updated daily on week days.
Initial download of the metrics may take a while.