Open Access
Fig. 2
Download original image
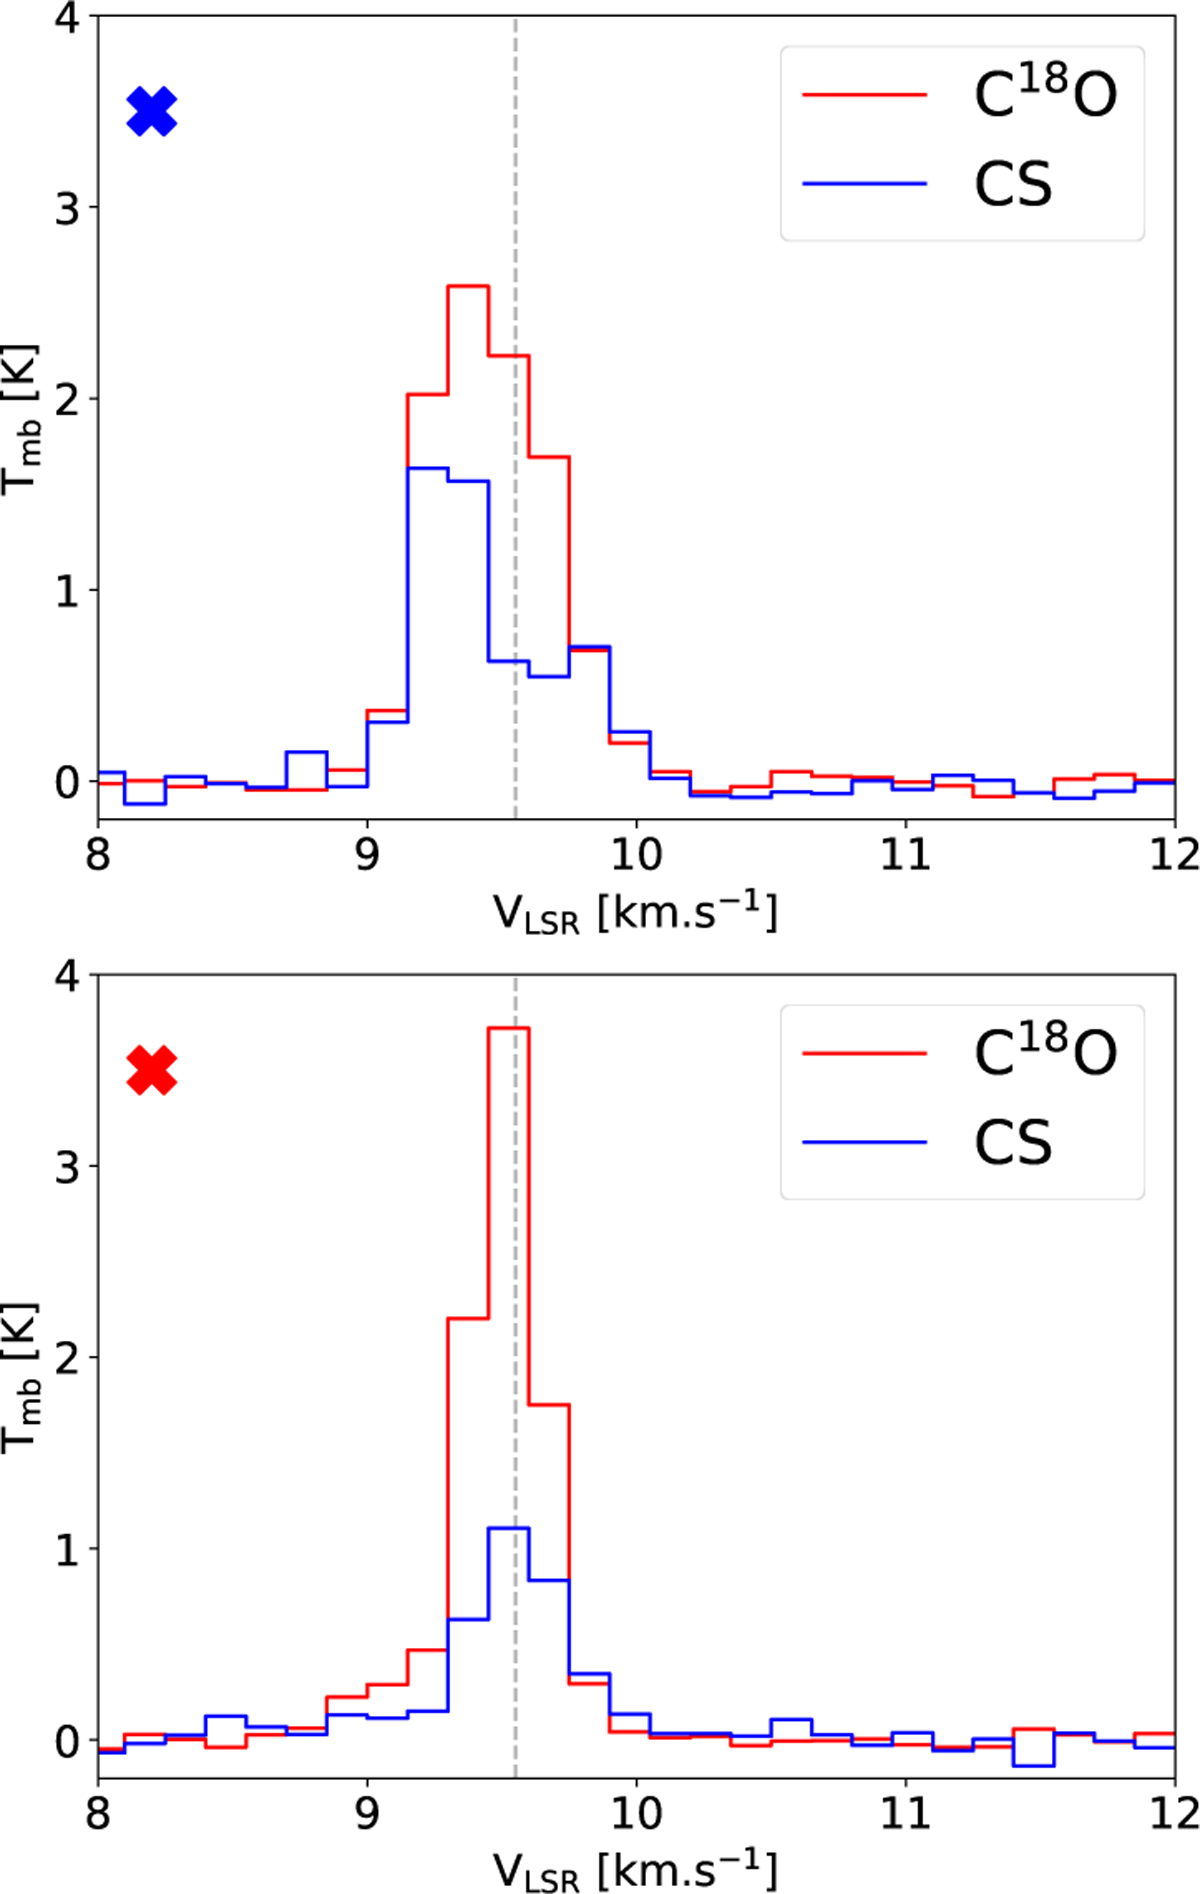
Upper: C18O and CS spectra on the core position represented by the dark blue cross on the maps. Lower: spectra of the same molecules at the position marked by the red cross in Fig 1. The grey dashed line is the centroid velocity.
Current usage metrics show cumulative count of Article Views (full-text article views including HTML views, PDF and ePub downloads, according to the available data) and Abstracts Views on Vision4Press platform.
Data correspond to usage on the plateform after 2015. The current usage metrics is available 48-96 hours after online publication and is updated daily on week days.
Initial download of the metrics may take a while.