Fig. 1
Download original image
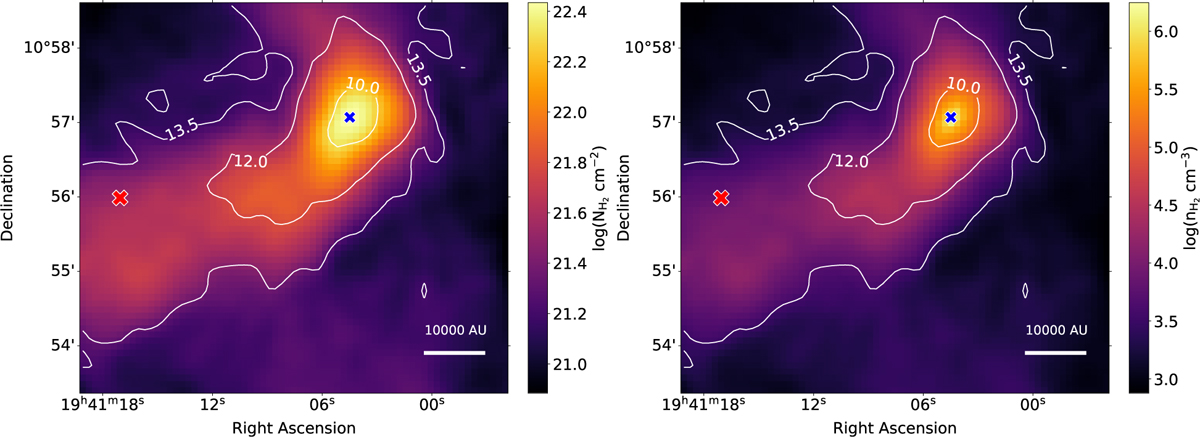
Left: H2 column density map (NH2 in cm−2) of L694, computed from Herschel maps at 250,350, and 500 μm. The position of the continuum peak is represented by the blue cross. The red cross is at an off-position, used to show the different velocity profile in Fig. 2. Right: H2 volume density (nH2 in cm−3) obtained from the method presented in Marchal et al. (2019). In both maps, the temperature (in K) appears in white contours, and the spatial scale is represented by the horizontal white bar (10 000 AU).
Current usage metrics show cumulative count of Article Views (full-text article views including HTML views, PDF and ePub downloads, according to the available data) and Abstracts Views on Vision4Press platform.
Data correspond to usage on the plateform after 2015. The current usage metrics is available 48-96 hours after online publication and is updated daily on week days.
Initial download of the metrics may take a while.