Open Access
Fig. 3
Download original image
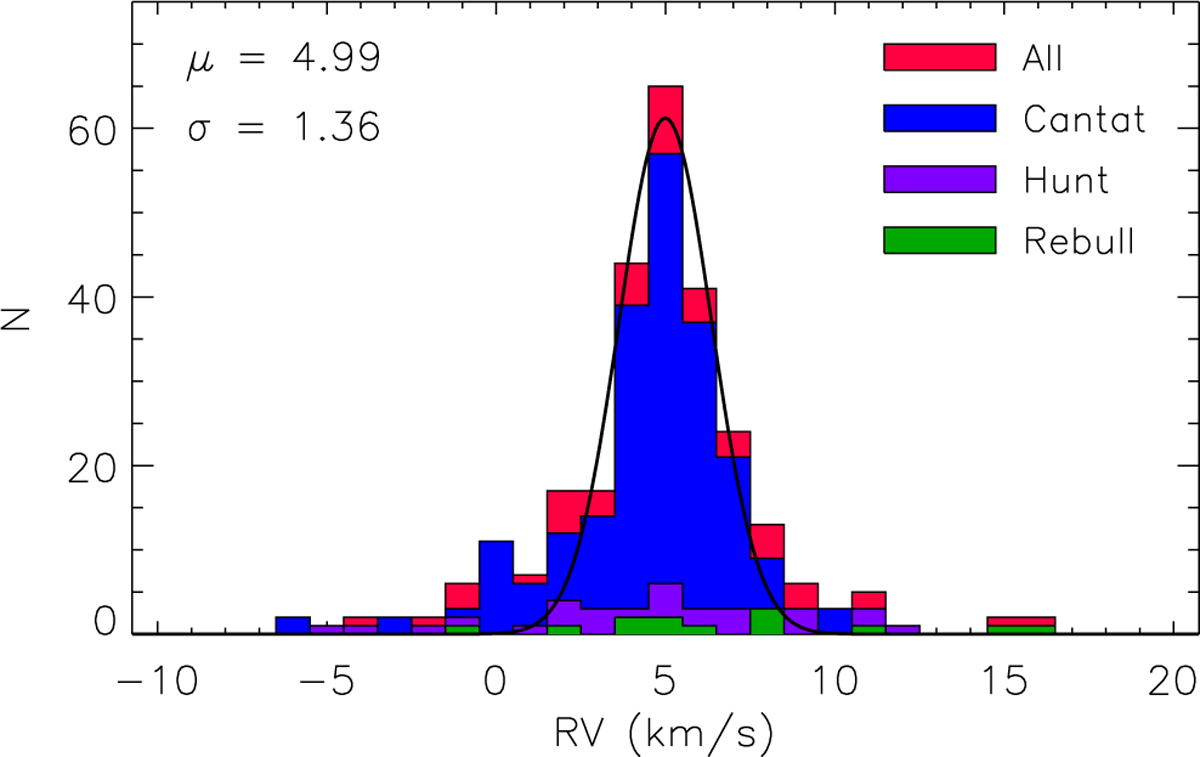
RV distribution obtained with all the analyzed LAMOST-MRS spectra of the cluster members (red histogram) and for the three sub-samples, as indicated in the legend. The Gaussian fit is overplotted with a full black line; the center (μ) and dispersion (σ) of the Gaussian are also marked.
Current usage metrics show cumulative count of Article Views (full-text article views including HTML views, PDF and ePub downloads, according to the available data) and Abstracts Views on Vision4Press platform.
Data correspond to usage on the plateform after 2015. The current usage metrics is available 48-96 hours after online publication and is updated daily on week days.
Initial download of the metrics may take a while.