Open Access
Fig. A.8
Download original image
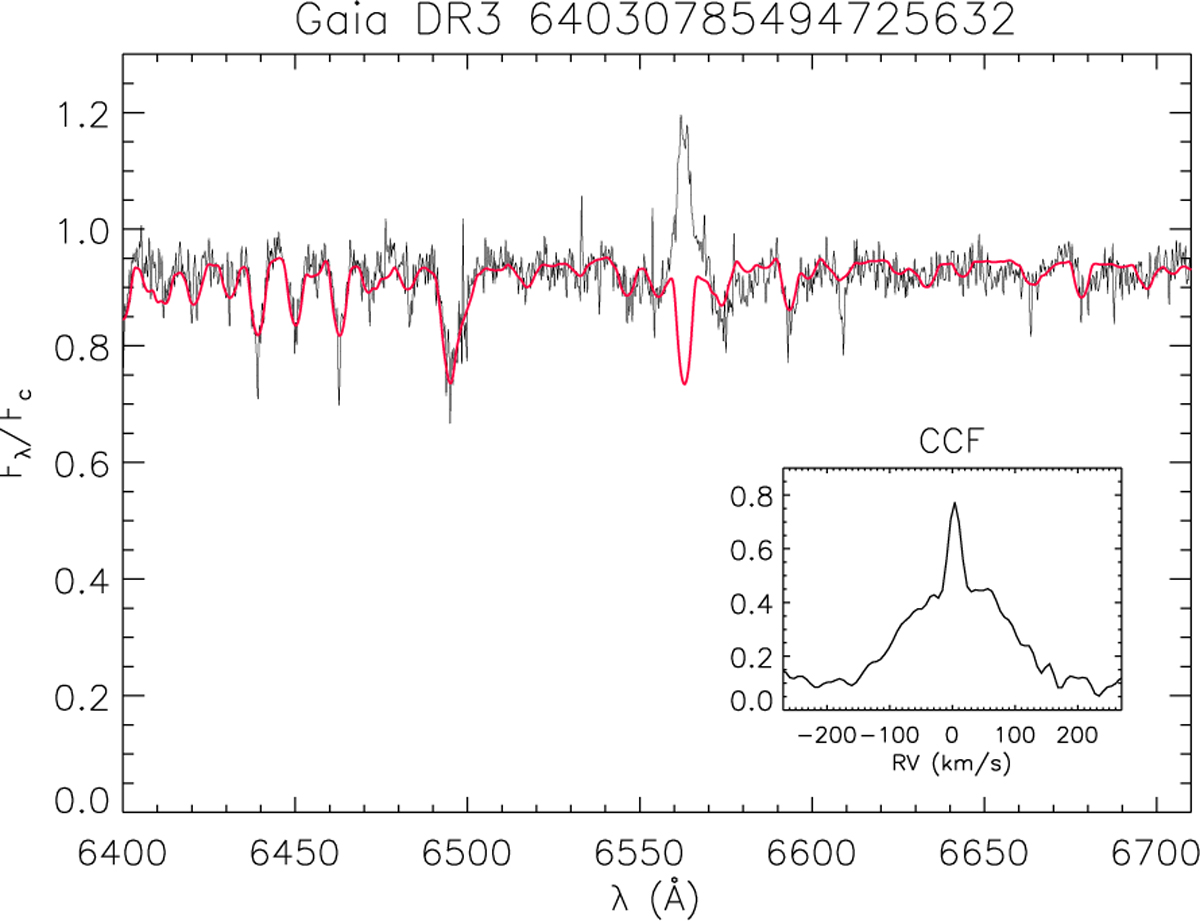
Red-arm spectrum of Gaia DR3 64030785494725632 (black line) with the best template (red line) found by ROTFIT that roughly fits the broad spectral lines. The cross-correlation function is displayed in the inset plot and clearly shows a broad and a narrow peak.
Current usage metrics show cumulative count of Article Views (full-text article views including HTML views, PDF and ePub downloads, according to the available data) and Abstracts Views on Vision4Press platform.
Data correspond to usage on the plateform after 2015. The current usage metrics is available 48-96 hours after online publication and is updated daily on week days.
Initial download of the metrics may take a while.