Open Access
Fig. A.7
Download original image
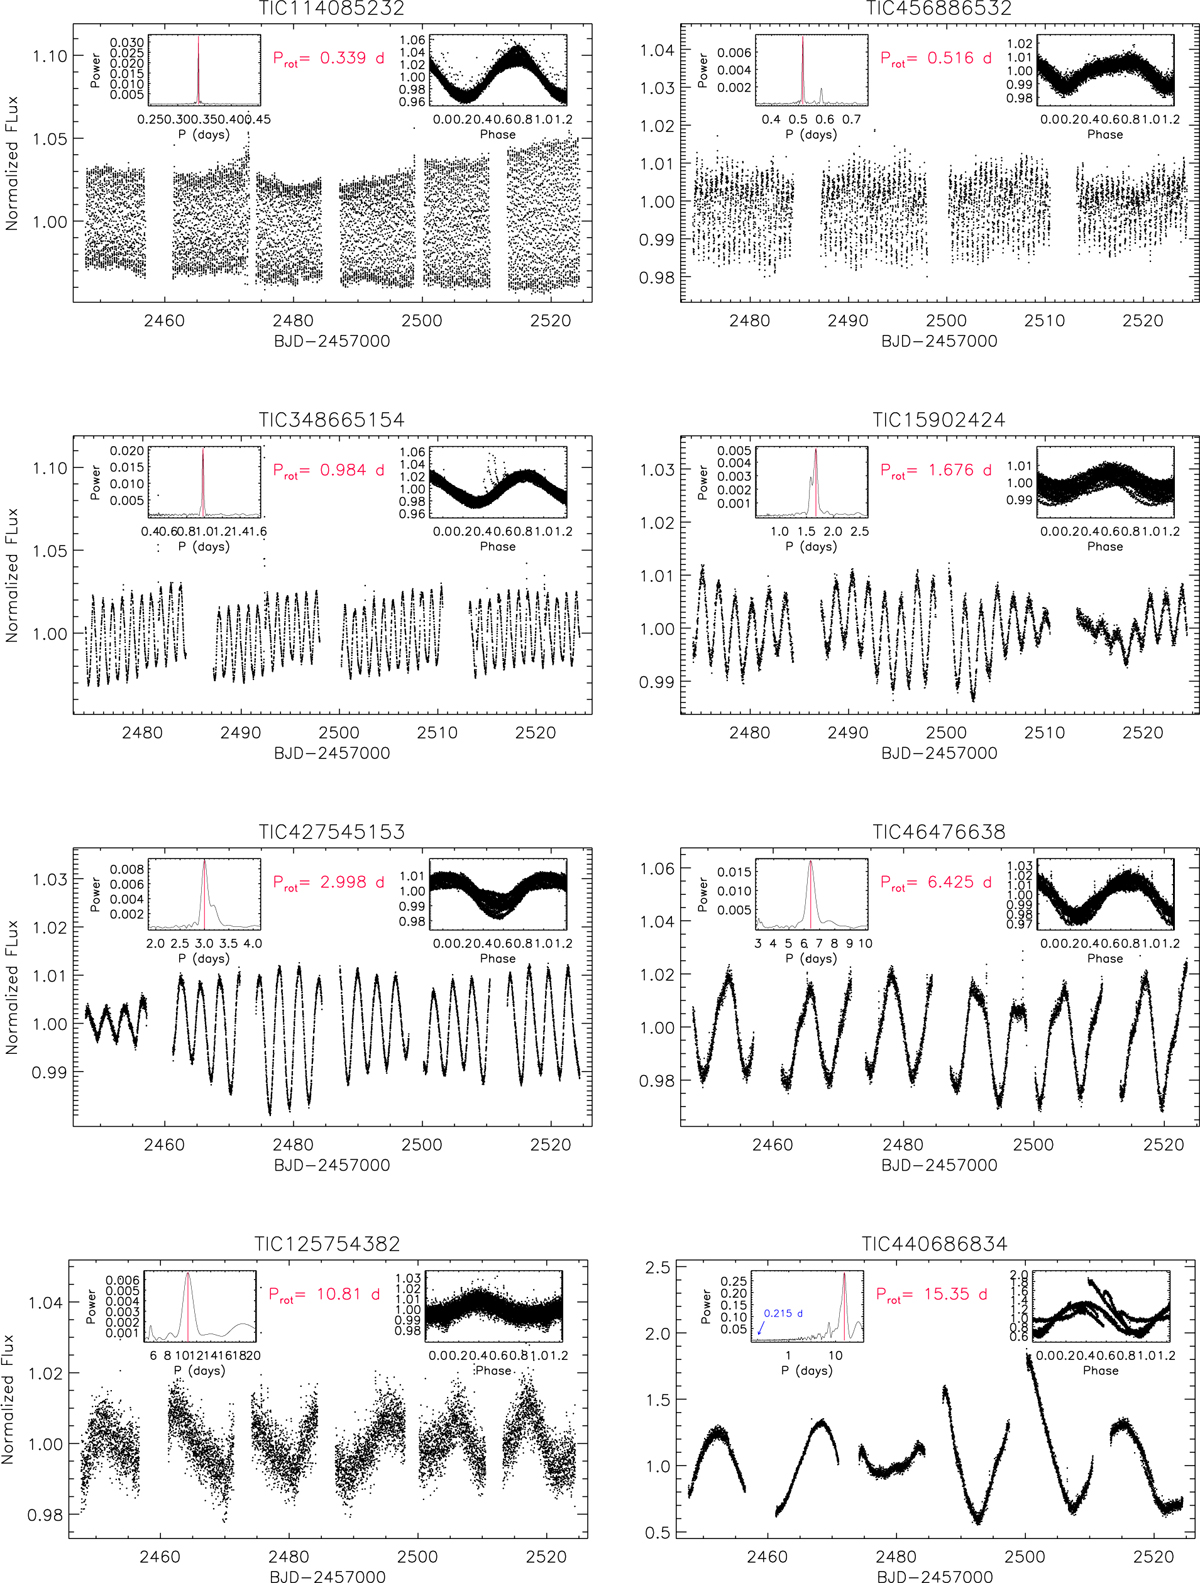
TESS light curves for a sample of Pleiades members. In each panel, the inset in the upper left corner shows the cleaned periodogram, with the period marked by a vertical red line and indicated with red characters. The inset in the upper right corner displays the data phased with this period.
Current usage metrics show cumulative count of Article Views (full-text article views including HTML views, PDF and ePub downloads, according to the available data) and Abstracts Views on Vision4Press platform.
Data correspond to usage on the plateform after 2015. The current usage metrics is available 48-96 hours after online publication and is updated daily on week days.
Initial download of the metrics may take a while.