Fig. A.5
Download original image
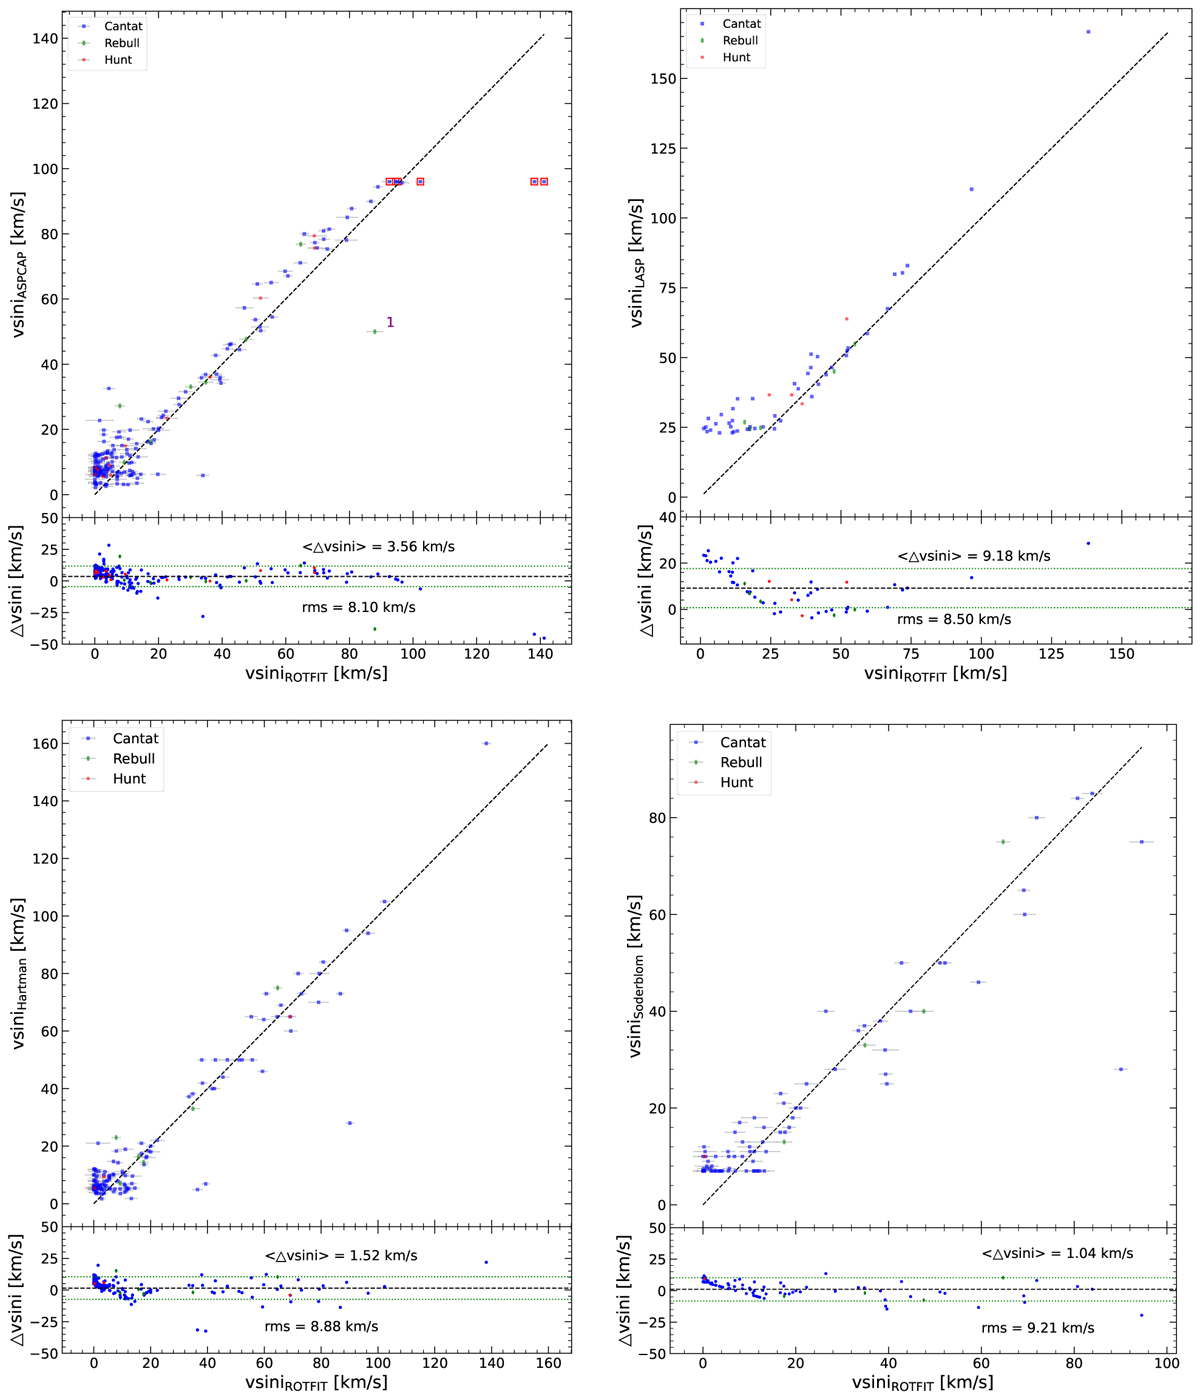
Comparison between the v sin i values measured in this work and those found in the literature. Top left panel: ROTFIT versus APOGEE-2 DR17 values (Abdurro’uf et al. 2022). The color of symbols distinguishes the three subsamples as in the previous figures and indicated in the legend. The one-to-one relation is shown by the dashed line. The v sin i differences between ROTFIT and APOGEE values, Δv sin i, are displayed in the lower box. Top right panel: Comparison with the LASP DR11 v1.0 v sin i values (https://www.lamost.org/dr11/v1.0). The meaning of lines and symbols is as in the left panel. Bottom left panel: ROTFIT versus (Hartman et al. 2010) v sin i values. Bottom right panel: ROTFIT versus Soderblom et al. (1993a) v sin i values.
Current usage metrics show cumulative count of Article Views (full-text article views including HTML views, PDF and ePub downloads, according to the available data) and Abstracts Views on Vision4Press platform.
Data correspond to usage on the plateform after 2015. The current usage metrics is available 48-96 hours after online publication and is updated daily on week days.
Initial download of the metrics may take a while.