Fig. 19
Download original image
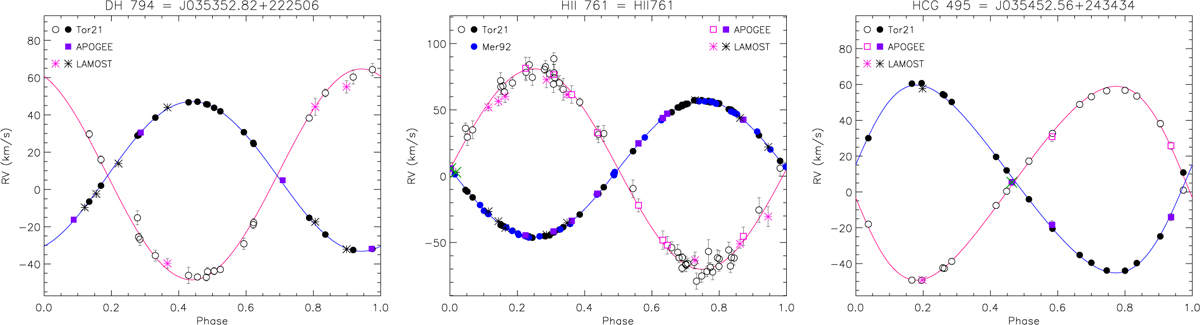
Radial velocity curves of three SB2 binaries: DH 794 (left panel), HII 761 (middle panel), and HCG 495 (right panel). The RV data of Torres et al. (2021) are shown by black dots and open circles for the primary and secondary component, respectively. The RVs of the primary and secondary components measured by us from the APOGEE DR17 spectra are plotted with purple filled and magenta open squares, respectively. Our LAMOST RVs are plotted with black and magenta asterisks for the primary and secondary component, respectively. The RV values measured near the conjunctions, when only one CCF peak is visible, are marked with green crosses. The orbital solution of Torres et al. (2021) is superimposed with a full blue and red line for the primary and secondary component, respectively.
Current usage metrics show cumulative count of Article Views (full-text article views including HTML views, PDF and ePub downloads, according to the available data) and Abstracts Views on Vision4Press platform.
Data correspond to usage on the plateform after 2015. The current usage metrics is available 48-96 hours after online publication and is updated daily on week days.
Initial download of the metrics may take a while.