Fig. 18
Download original image
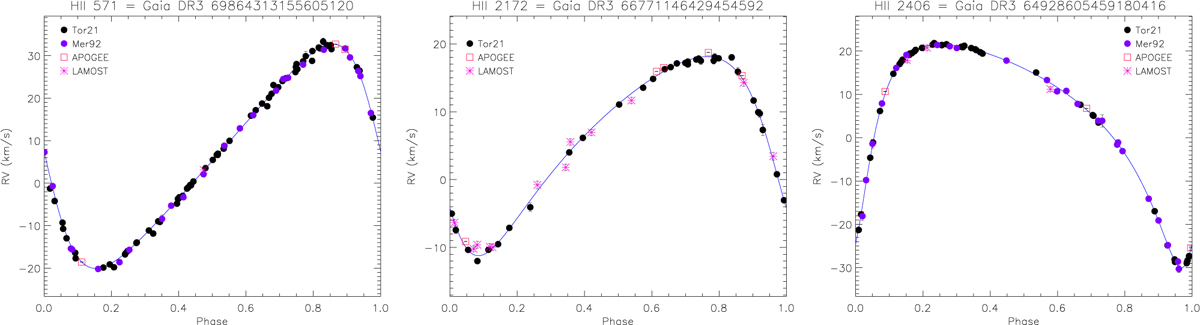
Radial velocity curves of three single-lined binaries: HII 517 (left panel), HII 2172 (=HD 282965; middle panel), and HII 2406 (right panel). The RV data of Mermilliod et al. (1992) and Torres et al. (2021) are shown by purple and black dots, respectively, while the APOGEE DR17 data (Abdurro’uf et al. 2022) and our LAMOST RVs are plotted with red squares and asterisks, respectively. The orbital solutions are superimposed with a full blue line.
Current usage metrics show cumulative count of Article Views (full-text article views including HTML views, PDF and ePub downloads, according to the available data) and Abstracts Views on Vision4Press platform.
Data correspond to usage on the plateform after 2015. The current usage metrics is available 48-96 hours after online publication and is updated daily on week days.
Initial download of the metrics may take a while.